
A quick look at the depth-age relationship for the seafloor.
Contents
A quick look at the depth-age relationship for the seafloor.
We can now try to do what we set out to do - obtain values on an appropriate grid and see what the data look like.
First a grid at fine resolution
import stripy
import numpy as np

even_mesh = stripy.spherical_meshes.icosahedral_mesh(include_face_points=True, tree=True, refinement_levels=6)
number_of_mesh_points = even_mesh.npoints

latitudes_in_radians = even_mesh.lats
latitudes_in_degrees = np.degrees(latitudes_in_radians)

longitudes_in_radians = even_mesh.lons
longitudes_in_degrees = np.degrees(longitudes_in_radians)%360.0 - 180.0
Have a look
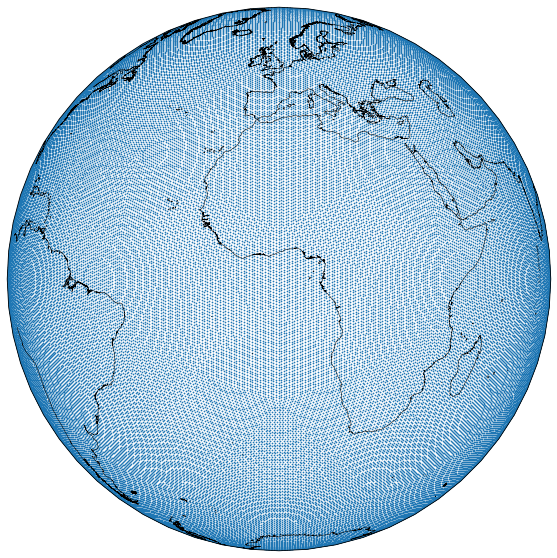
Here we plot the points on the globe to demonstrate that the points are evenly spaced and sufficiently well resolved
import matplotlib.pyplot as plt
%matplotlib inline

import cartopy.crs as ccrs
import cartopy.feature as cfeature

coastline = cfeature.NaturalEarthFeature('physical', 'coastline', '10m',
                           edgecolor=(1.0,0.8,0.0),
                           facecolor="none")

plt.figure(figsize=(15, 10))
ax = plt.subplot(111, projection=ccrs.Orthographic(central_longitude=0.1))

ax.add_feature(coastline, edgecolor="black", linewidth=0.5, zorder=3)

plt.scatter(longitudes_in_degrees, latitudes_in_degrees, s=0.5,
            transform=ccrs.PlateCarree())
<matplotlib.collections.PathCollection at 0x1502dc2b0>
Find the age and depth values on these points
Now we interpolate each of our datasets to the same set of grid points. First we need to define the interpolation routine again.
def map_raster_to_mesh(mesh, latlongrid):

    raster = latlongrid.T

    latitudes_in_radians  = mesh.lats
    longitudes_in_radians = mesh.lons
    latitudes_in_degrees  = np.degrees(latitudes_in_radians)
    longitudes_in_degrees = np.degrees(longitudes_in_radians)%360.0 - 180.0

    dlons = np.mod(longitudes_in_degrees+180.0, 360.0)
    dlats = np.mod(latitudes_in_degrees+90, 180.0)

    ilons = raster.shape[0] * dlons / 360.0
    ilats = raster.shape[1] * dlats / 180.0

    icoords = np.array((ilons, ilats))

    from scipy import ndimage

    mvals = ndimage.map_coordinates(raster, icoords , order=3, mode='nearest').astype(np.float)

    return mvals
Interpolate age data to fine, triangular grid.
(You can plot the results as before to see that you have not made a mistake)
plt.figure(figsize=(6, 6))
ax = plt.subplot(111, projection=ccrs.Orthographic(central_longitude=0.1))

ax.add_feature(coastline, edgecolor="black", linewidth=0.5, zorder=3)

plt.scatter(longitudes_in_degrees, latitudes_in_degrees, c=meshages, cmap="RdYlBu",
            vmin=0, vmax=250, s=5,
            transform=ccrs.Geodetic())
import xarray

age_dataset = "../Data/age.3.6.nc"
age_data = xarray.open_dataset(age_dataset)
subs_data = age_data.sel(x=slice(-180,180, 1), y=slice(-90, 90, 1))

lons = subs_data.coords.get('x')
lats = subs_data.coords.get('y')
vals = subs_data['z']

x,y = np.meshgrid(lons.data, lats.data)
age = vals.data / 100.0
age[np.isnan(age)] = -1.0

meshages = map_raster_to_mesh(even_mesh, age)
/var/folders/g3/zs57lnv5087f66fcky707_ww0000gp/T/ipykernel_18842/1013484211.py:20: DeprecationWarning: `np.float` is a deprecated alias for the builtin `float`. To silence this warning, use `float` by itself. Doing this will not modify any behavior and is safe. If you specifically wanted the numpy scalar type, use `np.float64` here.
Deprecated in NumPy 1.20; for more details and guidance: https://numpy.org/devdocs/release/1.20.0-notes.html#deprecations
  mvals = ndimage.map_coordinates(raster, icoords , order=3, mode='nearest').astype(np.float)
Interpolate height data to fine, triangular grid.
(You can plot the results as before to see that you have not made a mistake)
You also should make a decision about the resolution of the data you want to download.
plt.figure(figsize=(6, 6))
ax = plt.subplot(111, projection=ccrs.Orthographic(central_longitude=0.1))

ax.add_feature(coastline, edgecolor="black", linewidth=0.5, zorder=3)

plt.scatter(longitudes_in_degrees, latitudes_in_degrees, c=meshheights, cmap="terrain",
            vmin=-5000, vmax=5000, s=2,
            transform=ccrs.Geodetic())
(left, bottom, right, top) = (-180, -90, 180, 90)
map_extent = ( left, right, bottom, top)

etopo_dataset = "http://thredds.socib.es/thredds/dodsC/ancillary_data/bathymetry/ETOPO1_Bed_g_gmt4.nc"
etopo_data = xarray.open_dataset(etopo_dataset)
subs_data = etopo_data.sel(x=slice(left,right, 180), y=slice(bottom, top, 180))

lons = subs_data.coords.get('x')
lats = subs_data.coords.get('y')
vals = subs_data['z']

x,y = np.meshgrid(lons.data, lats.data)
height = vals.data

meshheights = map_raster_to_mesh(even_mesh, height)
/var/folders/g3/zs57lnv5087f66fcky707_ww0000gp/T/ipykernel_18842/1013484211.py:20: DeprecationWarning: `np.float` is a deprecated alias for the builtin `float`. To silence this warning, use `float` by itself. Doing this will not modify any behavior and is safe. If you specifically wanted the numpy scalar type, use `np.float64` here.
Deprecated in NumPy 1.20; for more details and guidance: https://numpy.org/devdocs/release/1.20.0-notes.html#deprecations
  mvals = ndimage.map_coordinates(raster, icoords , order=3, mode='nearest').astype(np.float)
plt.figure(figsize=(6, 6))
ax = plt.subplot(111)
ax.set_xlim(0,150)
ax.set_ylim(-7000,-2000)

plt.scatter( meshages[meshheights<-2000], meshheights[meshheights<-2000], s=1.0, alpha=0.5)
plt.savefig("MyAwesomePlot.png", dpi=250)
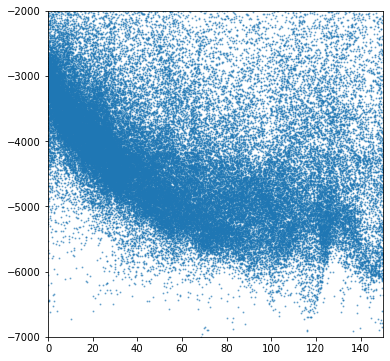
Oh No !!
That looks terrible doesn’t it ? But all is not lost …
Exercise
Try this: make the points smaller (s=1.0) and make them a bit see-through (alpha=0.2) and now take a look.
Increase the resolution of your samples in topography. That might make a difference too.
Finally, how about trying more grid points ?