
Crust 1.0 data
Crust 1.0 data
Crust 1.0 is built on a regular grid — it is also wrapped in the litho1pt0 module
import litho1pt0 as litho
import numpy as np
# The full descriptions of the numbers in the table
print (litho.c1_region_descriptor )

# The table of data
crust_type = litho._c1_crust_type_lat_lon
print ("Resolution: ", crust_type.shape)
print (crust_type)
['Platform', 'Slow, thin Platform', 'Archean (Antarctica)', 'Early Archean', 'Late Archean', 'Early/mid  Proter.,', 'Early/mid  Proter. (Antarctica, slow)', 'Late Proter.', 'Slow late Proter.', 'Island arc', 'Forearc', 'Continental arc', 'Slow continental arc', 'Extended crust', 'Fast extended crust (Antarctica)', 'Orogen (Antarctica), thick upper, thin lower crust', 'Orogen, thick upper crust, very thin lower crust', 'Orogen, thick upper crust, fast middle crust', 'Orogen with slow lower crust (Andes)', 'Slow orogen (Himalaya)', 'Margin-continent/shield  transition', 'Slow Margin/Shield (Antarctica)', 'Rift', 'Phanerozoic', 'Fast Phanerozoic (E. Australia, S. Africa, N. Siberia)', 'Normal oceanic', 'Oceans 3 Myrs and younger', 'Melt affected o.c. and oceanic plateaus', 'Continental shelf', 'Continental slope, margin, transition', 'Inactive ridge, Alpha Ridge', 'Thinned cont. crust, Red Sea', 'Oceanic plateau with cont. crust', 'Caspian depression', 'Intermed. cont./oc. crust, Black Sea', 'Caspian Sea oceanic']
Resolution:  (180, 360)
[[25 25 25 ... 25 25 25]
 [25 25 25 ... 25 25 25]
 [25 25 25 ... 25 25 25]
 ...
 [23 23 23 ... 23 23 23]
 [23 23 23 ... 23 23 23]
 [23 23 23 ... 23 23 23]]
gridlonv, gridlatv = np.meshgrid(np.linspace(0,360,720), np.linspace(-90,90,360), sparse=False, indexing='xy')

crust_type_i = np.empty_like(gridlonv, dtype=int)
for i in range(0, gridlonv.shape[0]):
    for j in range(0, gridlonv.shape[1]):
        crust_type_i[i,j]= litho.crust_type_at(lon=gridlonv[i,j], lat=gridlatv[i,j])
import cartopy
import cartopy.crs as ccrs
import matplotlib.pyplot as plt
import matplotlib.colors as colors


global_extent     = [-180.0, 180.0, -89, 89]

projection1 = ccrs.Orthographic(central_longitude=140.0, central_latitude=0.0, globe=None)
projection2 = ccrs.Mollweide()
projection3 = ccrs.Robinson()

base_projection = ccrs.PlateCarree()
!ls ../../Mapping/
ls: ../../Mapping/: No such file or directory
## Background image

import xarray
import h5netcdf

(left, bottom, right, top) = (-180, -90, 180, 90)
map_extent = ( left, right, bottom, top)

etopo_dataset = "http://thredds.socib.es/thredds/dodsC/ancillary_data/bathymetry/ETOPO1_Bed_g_gmt4.nc"
etopo_data = xarray.open_dataset(etopo_dataset, engine="netcdf4")
regional_data = etopo_data.sel(x=slice(left,right,30), y=slice(bottom, top,30))

lons = regional_data.coords.get('x')
lats = regional_data.coords.get('y')
vals = regional_data['z']

x,y = np.meshgrid(lons.data, lats.data)
globaletopo_img = vals.data


from matplotlib.colors import LightSource, Normalize

cmap=plt.cm.Greys
ls = LightSource(315, 45)
hillshade = ls.shade(globaletopo_img, cmap, vert_exag=0.0005)[1::,1::]

## Drop one point here because the data are 361 x 721 !!
%matplotlib inline
from matplotlib import colors
crust1pt0_clist = [
# Platforms
"#6666ff",
"#b3b3ff",
# Archean / Proterozoic
"#003366",
"#003366",
"#004d99",
"#0066cc",
"#0066cc",
"#0080ff",
"#4da6ff",
# Arcs
"#b30000",
"#e60000",
"#ff6666",
"#ff9999",
# Extended crust
"#00cc88",
"#00cc88",
# Orogens
"#ff751a",
"#ff6600",
"#ff8533",
"#b34700",
"#ff9933",
# Margin
"#e6e600", # <- C. Margin
"#6666ff",
# Rifted and Extended
"#66ff99", # 3 Rifted / extended
# Phanerozoic
"#009999",
"#00e6e6",
# Oceans and plateau
"#BBBBBB",
"#BBBBBB",
"#BBBBBB",
"#e6e600", # <-- Shelf
"#b3b300", # <-- C. Slope
# Other
"#BBBBBB",
"#BBBBBB",
"#cccca3", # <- oceanic plateau / continental
"#BBBBBB",
"#BBBBBB",
"#BBBBBB" # 6 other
]
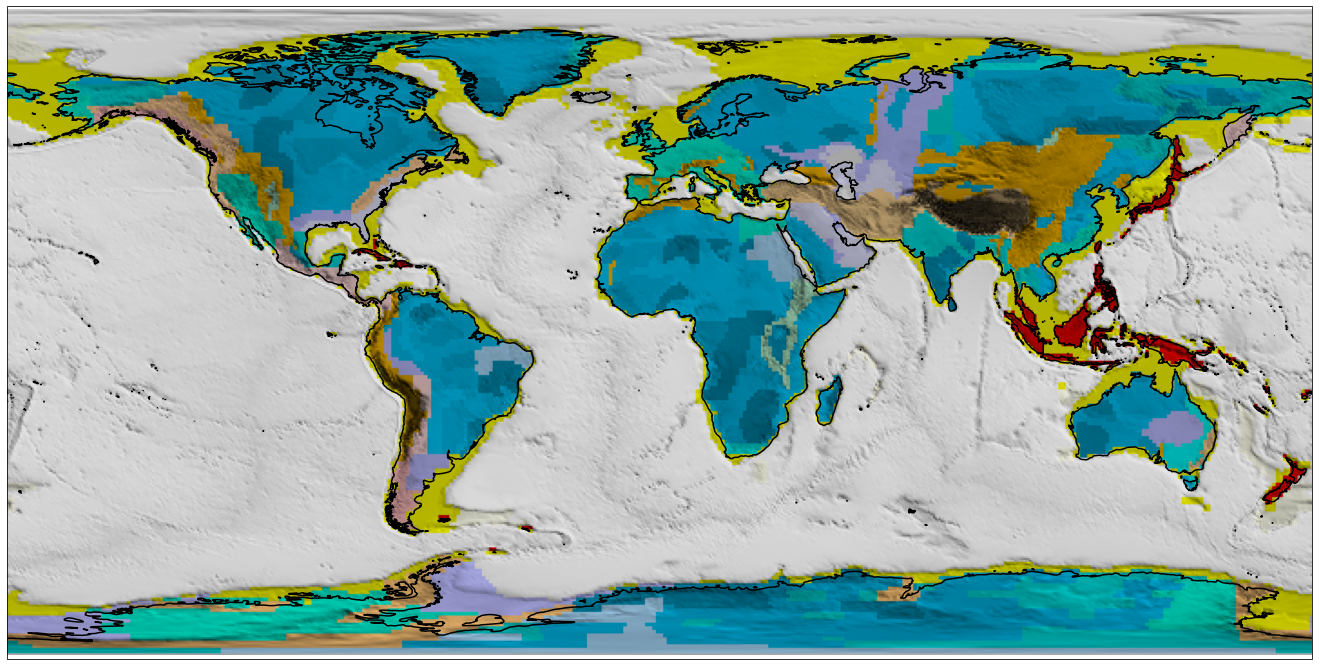
# map the image with the colors
crust_color_image = np.empty((crust_type_i.shape+(3,)))
for i in range(0,crust_type_i.shape[0]):
for j in range (0,crust_type_i.shape[1]):
crust_color_image[i,j] = colors.hex2color(crust1pt0_clist[crust_type_i[i,j]])
# crust_color_image2 = np.flipud(crust_color_image)
crust_color_image = crust_color_image**0.333 * hillshade[:,:,0:3]
fig = plt.figure(figsize=(24, 12), facecolor="none")
ax  = plt.subplot(111, projection=ccrs.PlateCarree())

# colormap = plt.cm.get_cmap(Crust1pt0, 36)

ax.set_global()

ax.imshow(crust_color_image, origin='lower', transform=base_projection,
          extent=global_extent, zorder=0)


#ax.add_feature(cartopy.feature.OCEAN, alpha=0.5, zorder=99, facecolor="#BBBBBB")
ax.coastlines(resolution="50m", zorder=100, linewidth=1.5)

# fig.savefig("Crust1.0-Regionalisation.png", dpi=300)
<cartopy.mpl.feature_artist.FeatureArtist at 0x143986b80>
for i, desc in enumerate(litho.c1_region_descriptor):
    print ("\t {:2d}: {}".format(i,desc))
	  0: Platform
	  1: Slow, thin Platform
	  2: Archean (Antarctica)
	  3: Early Archean
	  4: Late Archean
	  5: Early/mid  Proter.,
	  6: Early/mid  Proter. (Antarctica, slow)
	  7: Late Proter.
	  8: Slow late Proter.
	  9: Island arc
	 10: Forearc
	 11: Continental arc
	 12: Slow continental arc
	 13: Extended crust
	 14: Fast extended crust (Antarctica)
	 15: Orogen (Antarctica), thick upper, thin lower crust
	 16: Orogen, thick upper crust, very thin lower crust
	 17: Orogen, thick upper crust, fast middle crust
	 18: Orogen with slow lower crust (Andes)
	 19: Slow orogen (Himalaya)
	 20: Margin-continent/shield  transition
	 21: Slow Margin/Shield (Antarctica)
	 22: Rift
	 23: Phanerozoic
	 24: Fast Phanerozoic (E. Australia, S. Africa, N. Siberia)
	 25: Normal oceanic
	 26: Oceans 3 Myrs and younger
	 27: Melt affected o.c. and oceanic plateaus
	 28: Continental shelf
	 29: Continental slope, margin, transition
	 30: Inactive ridge, Alpha Ridge
	 31: Thinned cont. crust, Red Sea
	 32: Oceanic plateau with cont. crust
	 33: Caspian depression
	 34: Intermed. cont./oc. crust, Black Sea
	 35: Caspian Sea oceanic
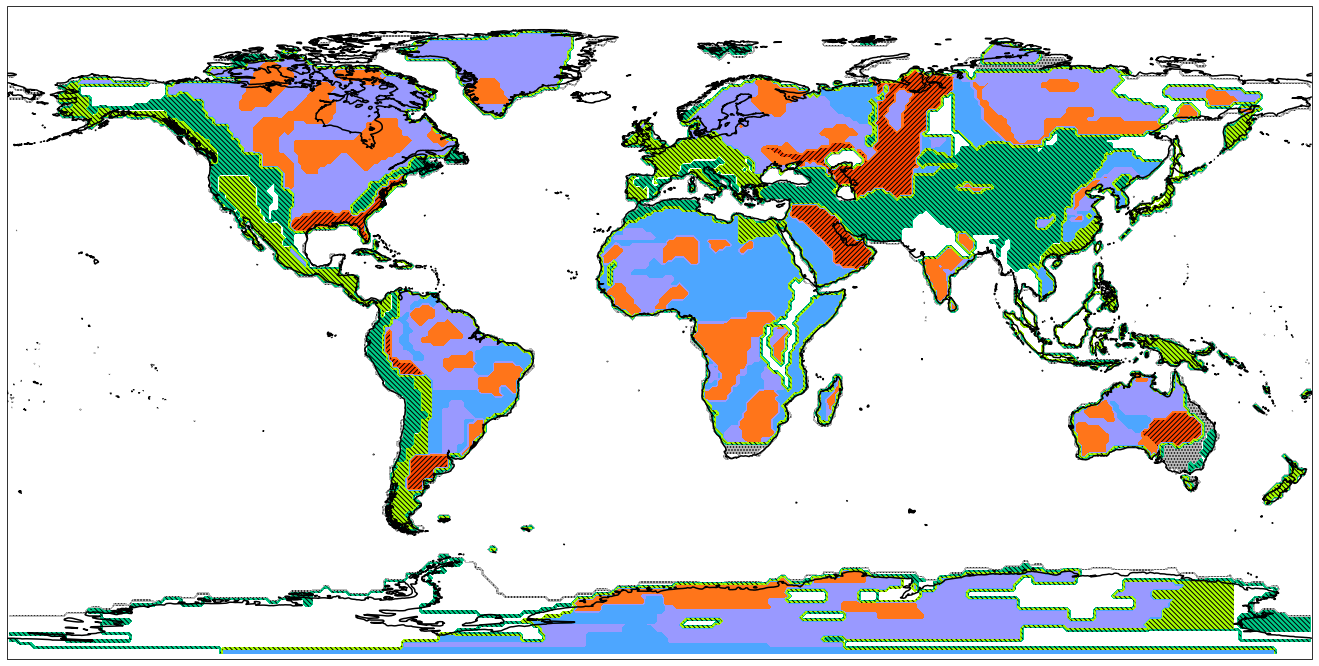
fig = plt.figure(figsize=(24, 12), facecolor="none")
ax  = plt.subplot(111, projection=ccrs.PlateCarree())

# colormap = plt.cm.get_cmap(Crust1pt0, 36)

ax.set_global()

# cmap = plt.get_cmap("Crust1pt0")
# ax.imshow(crust_color_image, origin='upper', transform=base_projection,
#           extent=global_extent, zorder=0, interpolation="lanczos")


# Platforms, Archean, Proterozoic

ax.contourf(crust_type, origin='upper', levels=[0.0, 1.5, 4.5, 6.5, 8.5],
                colors=[ "#FF4400", "#ff751a", "#9999FF", "#4da6ff"],
                hatches=["/////", "", "", ""],
                extent=global_extent, transform=base_projection)


# Phanerozoic

ax.contourf(crust_type, origin='upper', levels=[23.0, 24.9],
                colors=[ "#BBBBBB"],
                hatches=["....", "", "", ""],
                extent=global_extent, transform=base_projection)


# Orogens

ax.contourf(crust_type, origin='upper', levels=[15.0,20.0],
                colors=[ "#00cc88", ],
                hatches=["\\"*5, "", "", ""],
                extent=global_extent, transform=base_projection)

# Arcs

ax.contourf(crust_type, origin='upper', levels=[9.0,13.0],
                colors=[ "#AAFF00", ],
                hatches=["\\"*5, "", "", ""],
                extent=global_extent, transform=base_projection)


#ax.add_feature(cartopy.feature.OCEAN, alpha=0.5, zorder=99, facecolor="#BBBBBB")
ax.coastlines(resolution="50m", zorder=100, linewidth=1.5)

# fig.savefig("Crust1.0-Regionalisation.png", dpi=300)
<cartopy.mpl.feature_artist.FeatureArtist at 0x14374bd00>
Now a worked example: Craton Averaged Properties