PHYS 3070
The Earth as one of many planets
In which we shall look around the solar system to understand which geological processes can be considered universal and which are unique to Earth.
General Principles of Geology
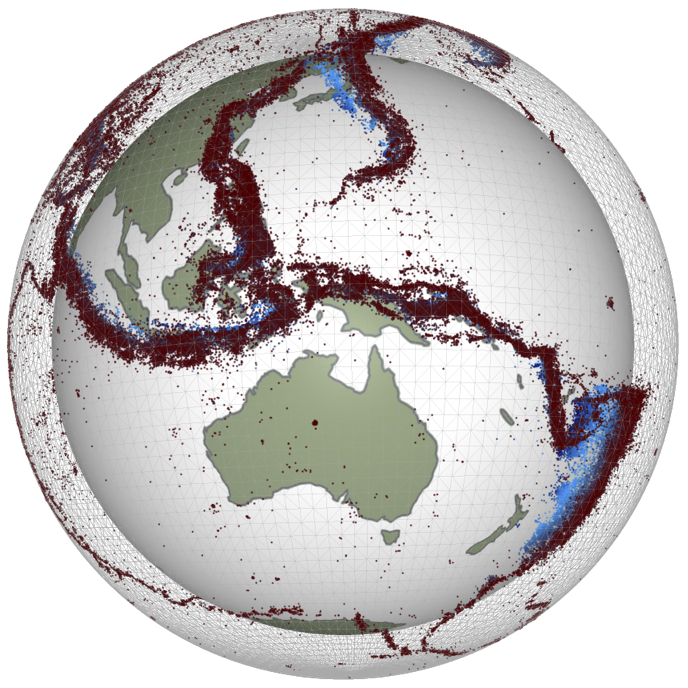
Geologists don’t get to choose the experiments they would like to see the Earth perform for them. They compare events from different places (and times) and assume they can generalize processes.
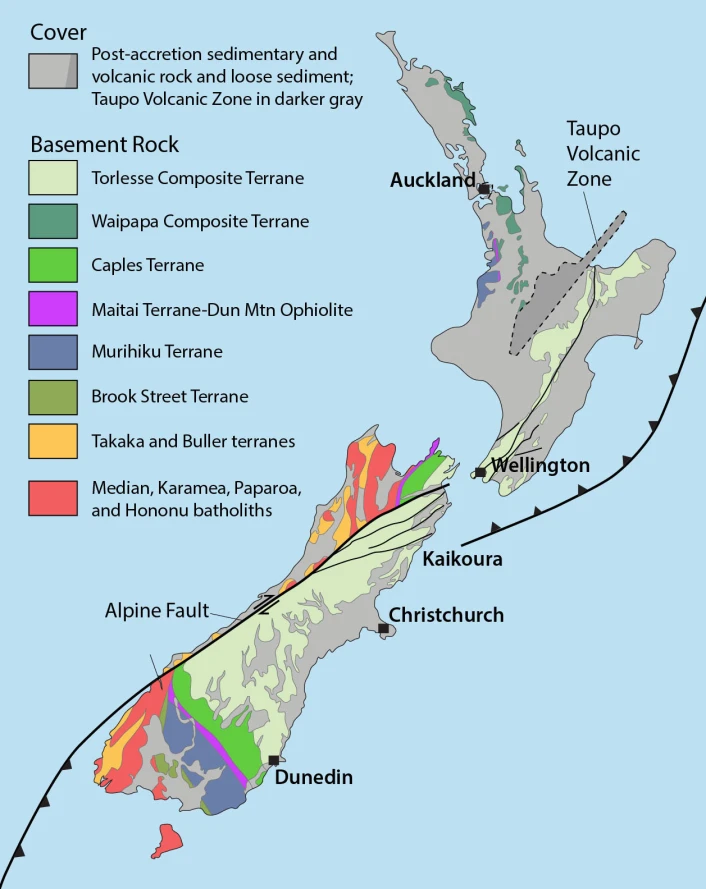
New Zealand: accreted terranes in colors and cover assemblage in gray. (Graham, Ian J. editor, 2015, A Continent on the Move, New Zealand Geoscience Revealed 2ed., Geoscience Society of New Zealand). W. Coast US: National Parks Service, Transform Plate Boundaries
Uniformity of processes from place to place and time to time (the present is the key to the past or vice versa)
Planetary Scale Comparisons
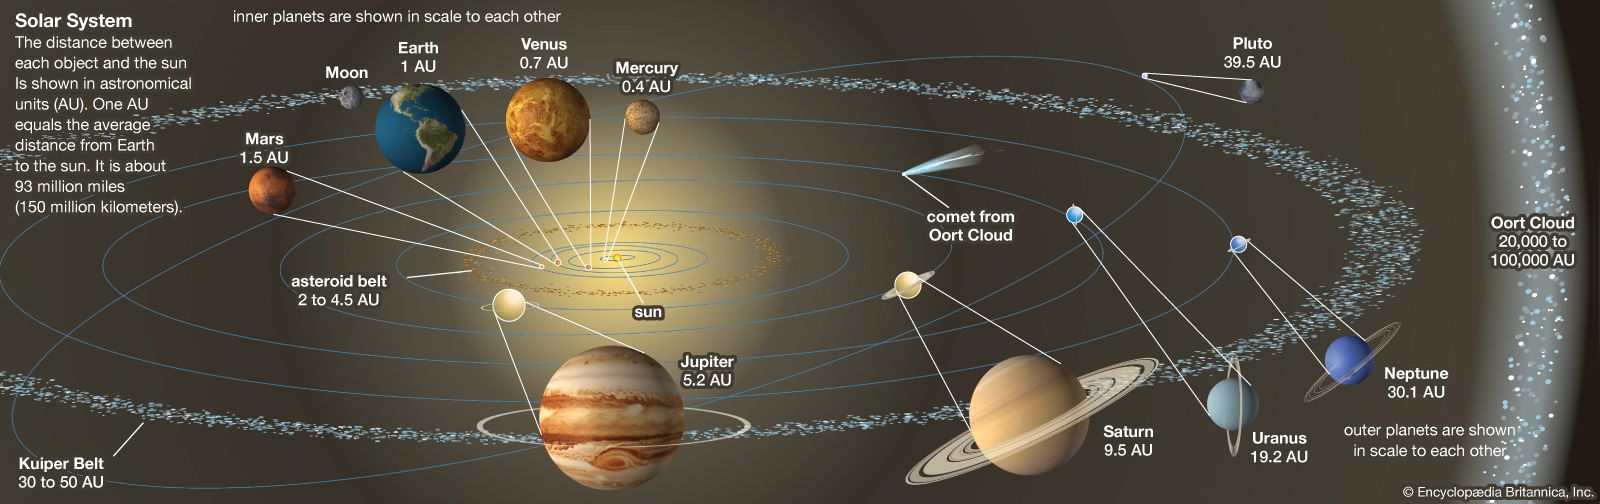
It’s much harder to find analogues when it comes to processes on the scale of the whole planet. We can try to look at other planets in the solar system.
Planetary Scale Comparisons (2)
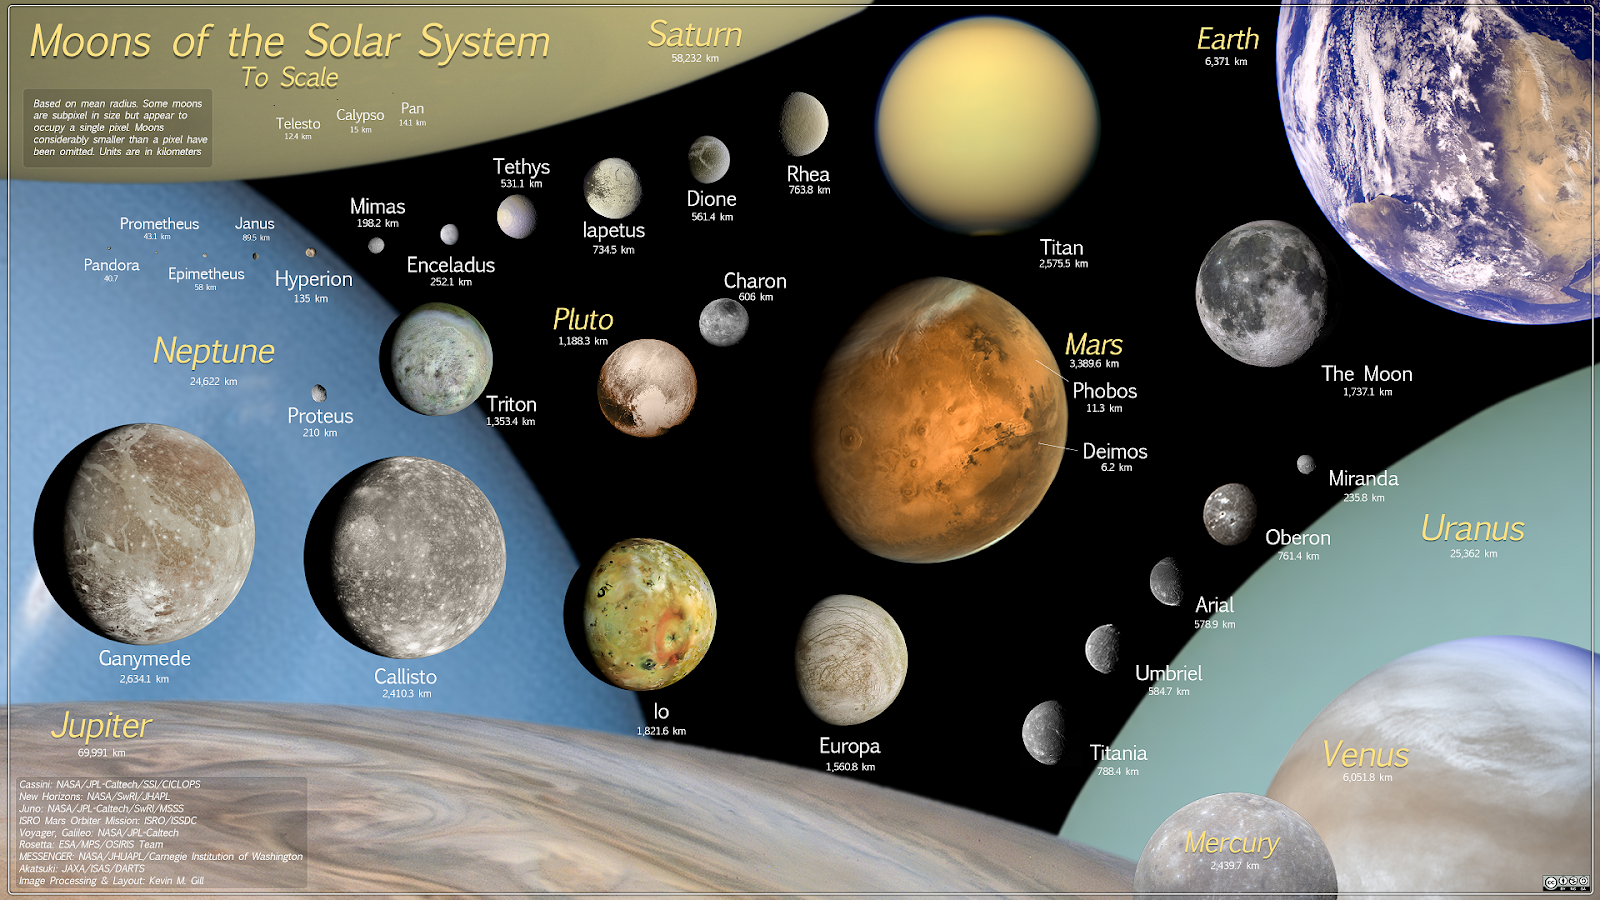
We can also look at the mini-solar systems of the giant planets. Some of the moons of Jupiter and Saturn are the size of small planets.
Planetary Scale Comparisons (3)
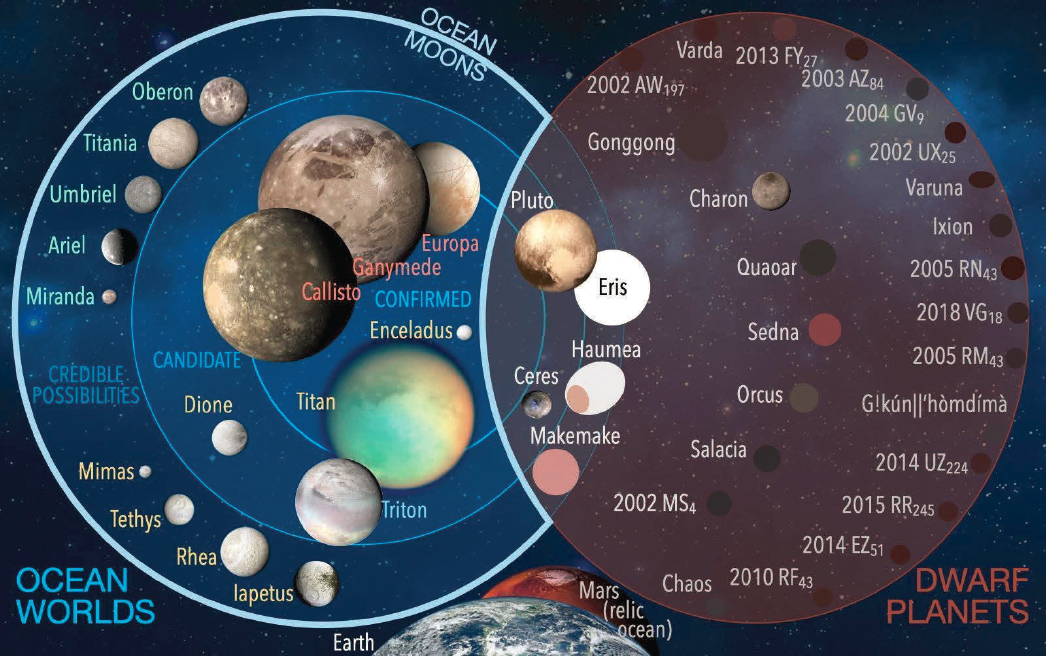
There are a number of dwarf planets and asteroids that are of significant size and that we can use as analogues for theories of planetary geology.
Planetary Scale Comparisons (4)
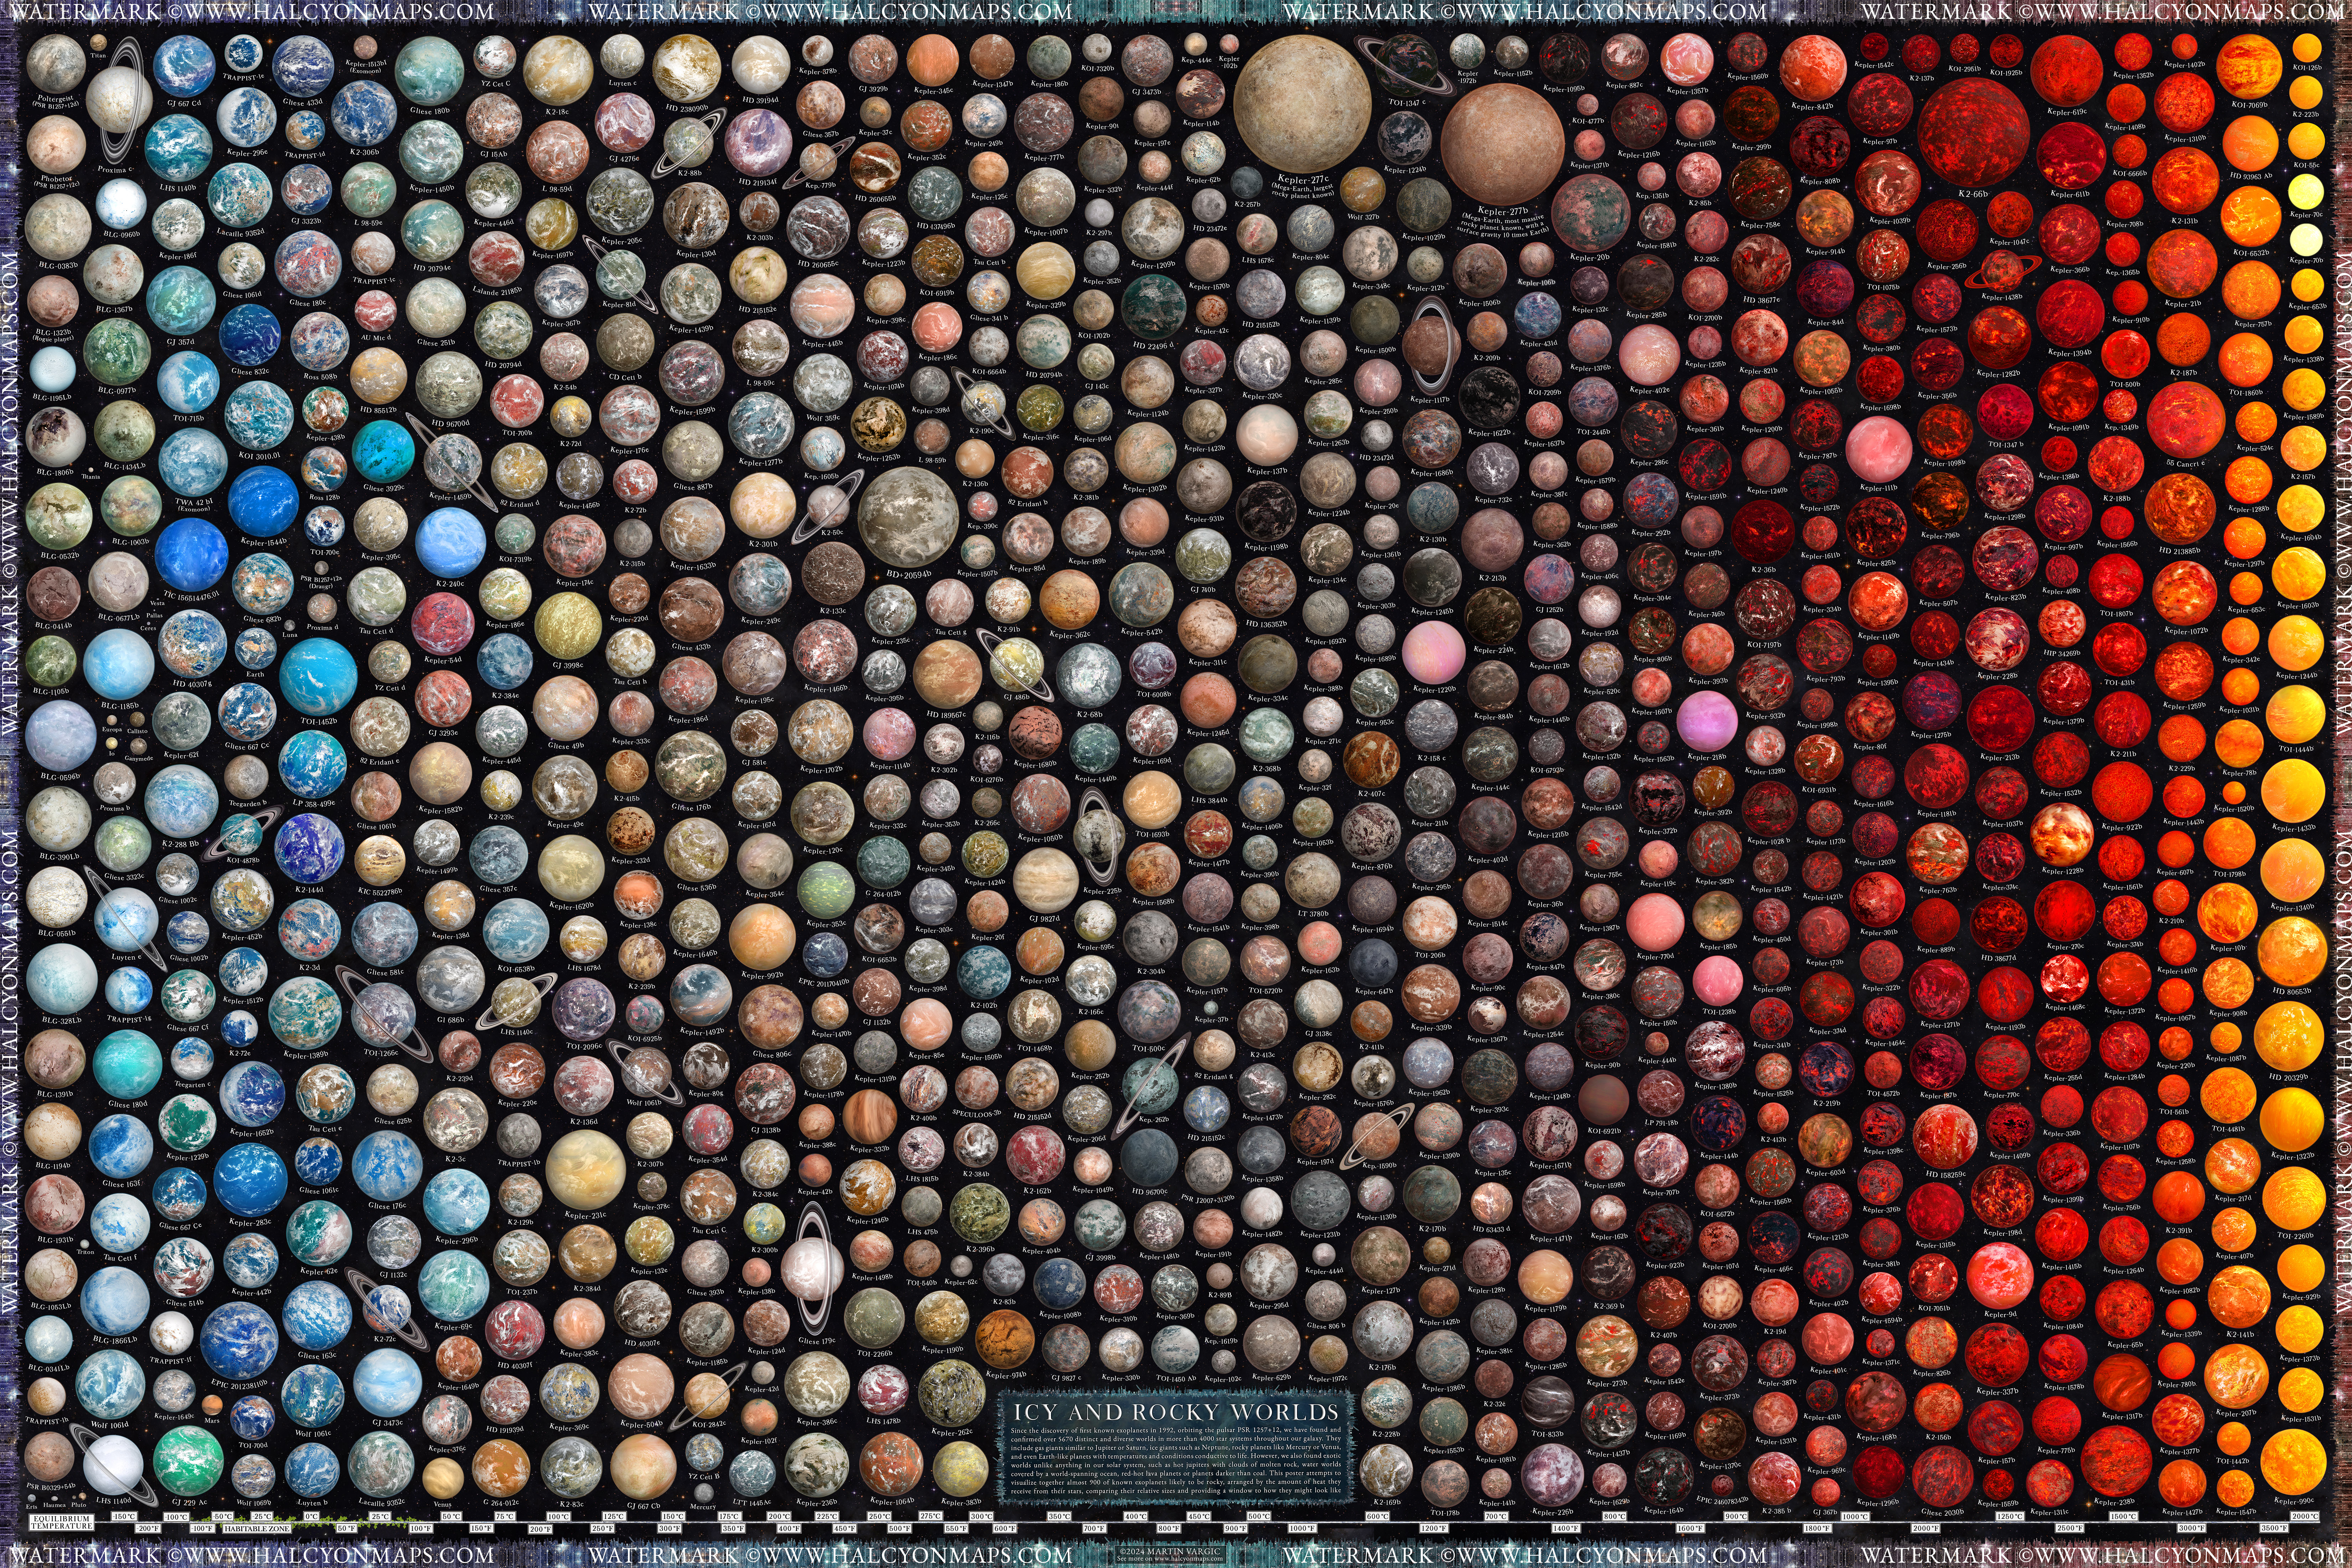
It would be nice if we could add all the exoplanets into this story but, regardless of the detail shown in these images, we only really know mass, radius and surface temperature.
Solar System Comparisons
Look at how close these exoplanets are to their star and look at their orbital periods. Trappist is a cool dwarf star but the habitable zone around it is debated. Do you think these Earth-like images are a fair representation of the weather systems ? Tidal heating, spin-orbit coupling, intense radiation / magnetic fields are likely to affect these planets as they do the moons of Jupiter in our solar system.
Venus Landforms - Tesserae
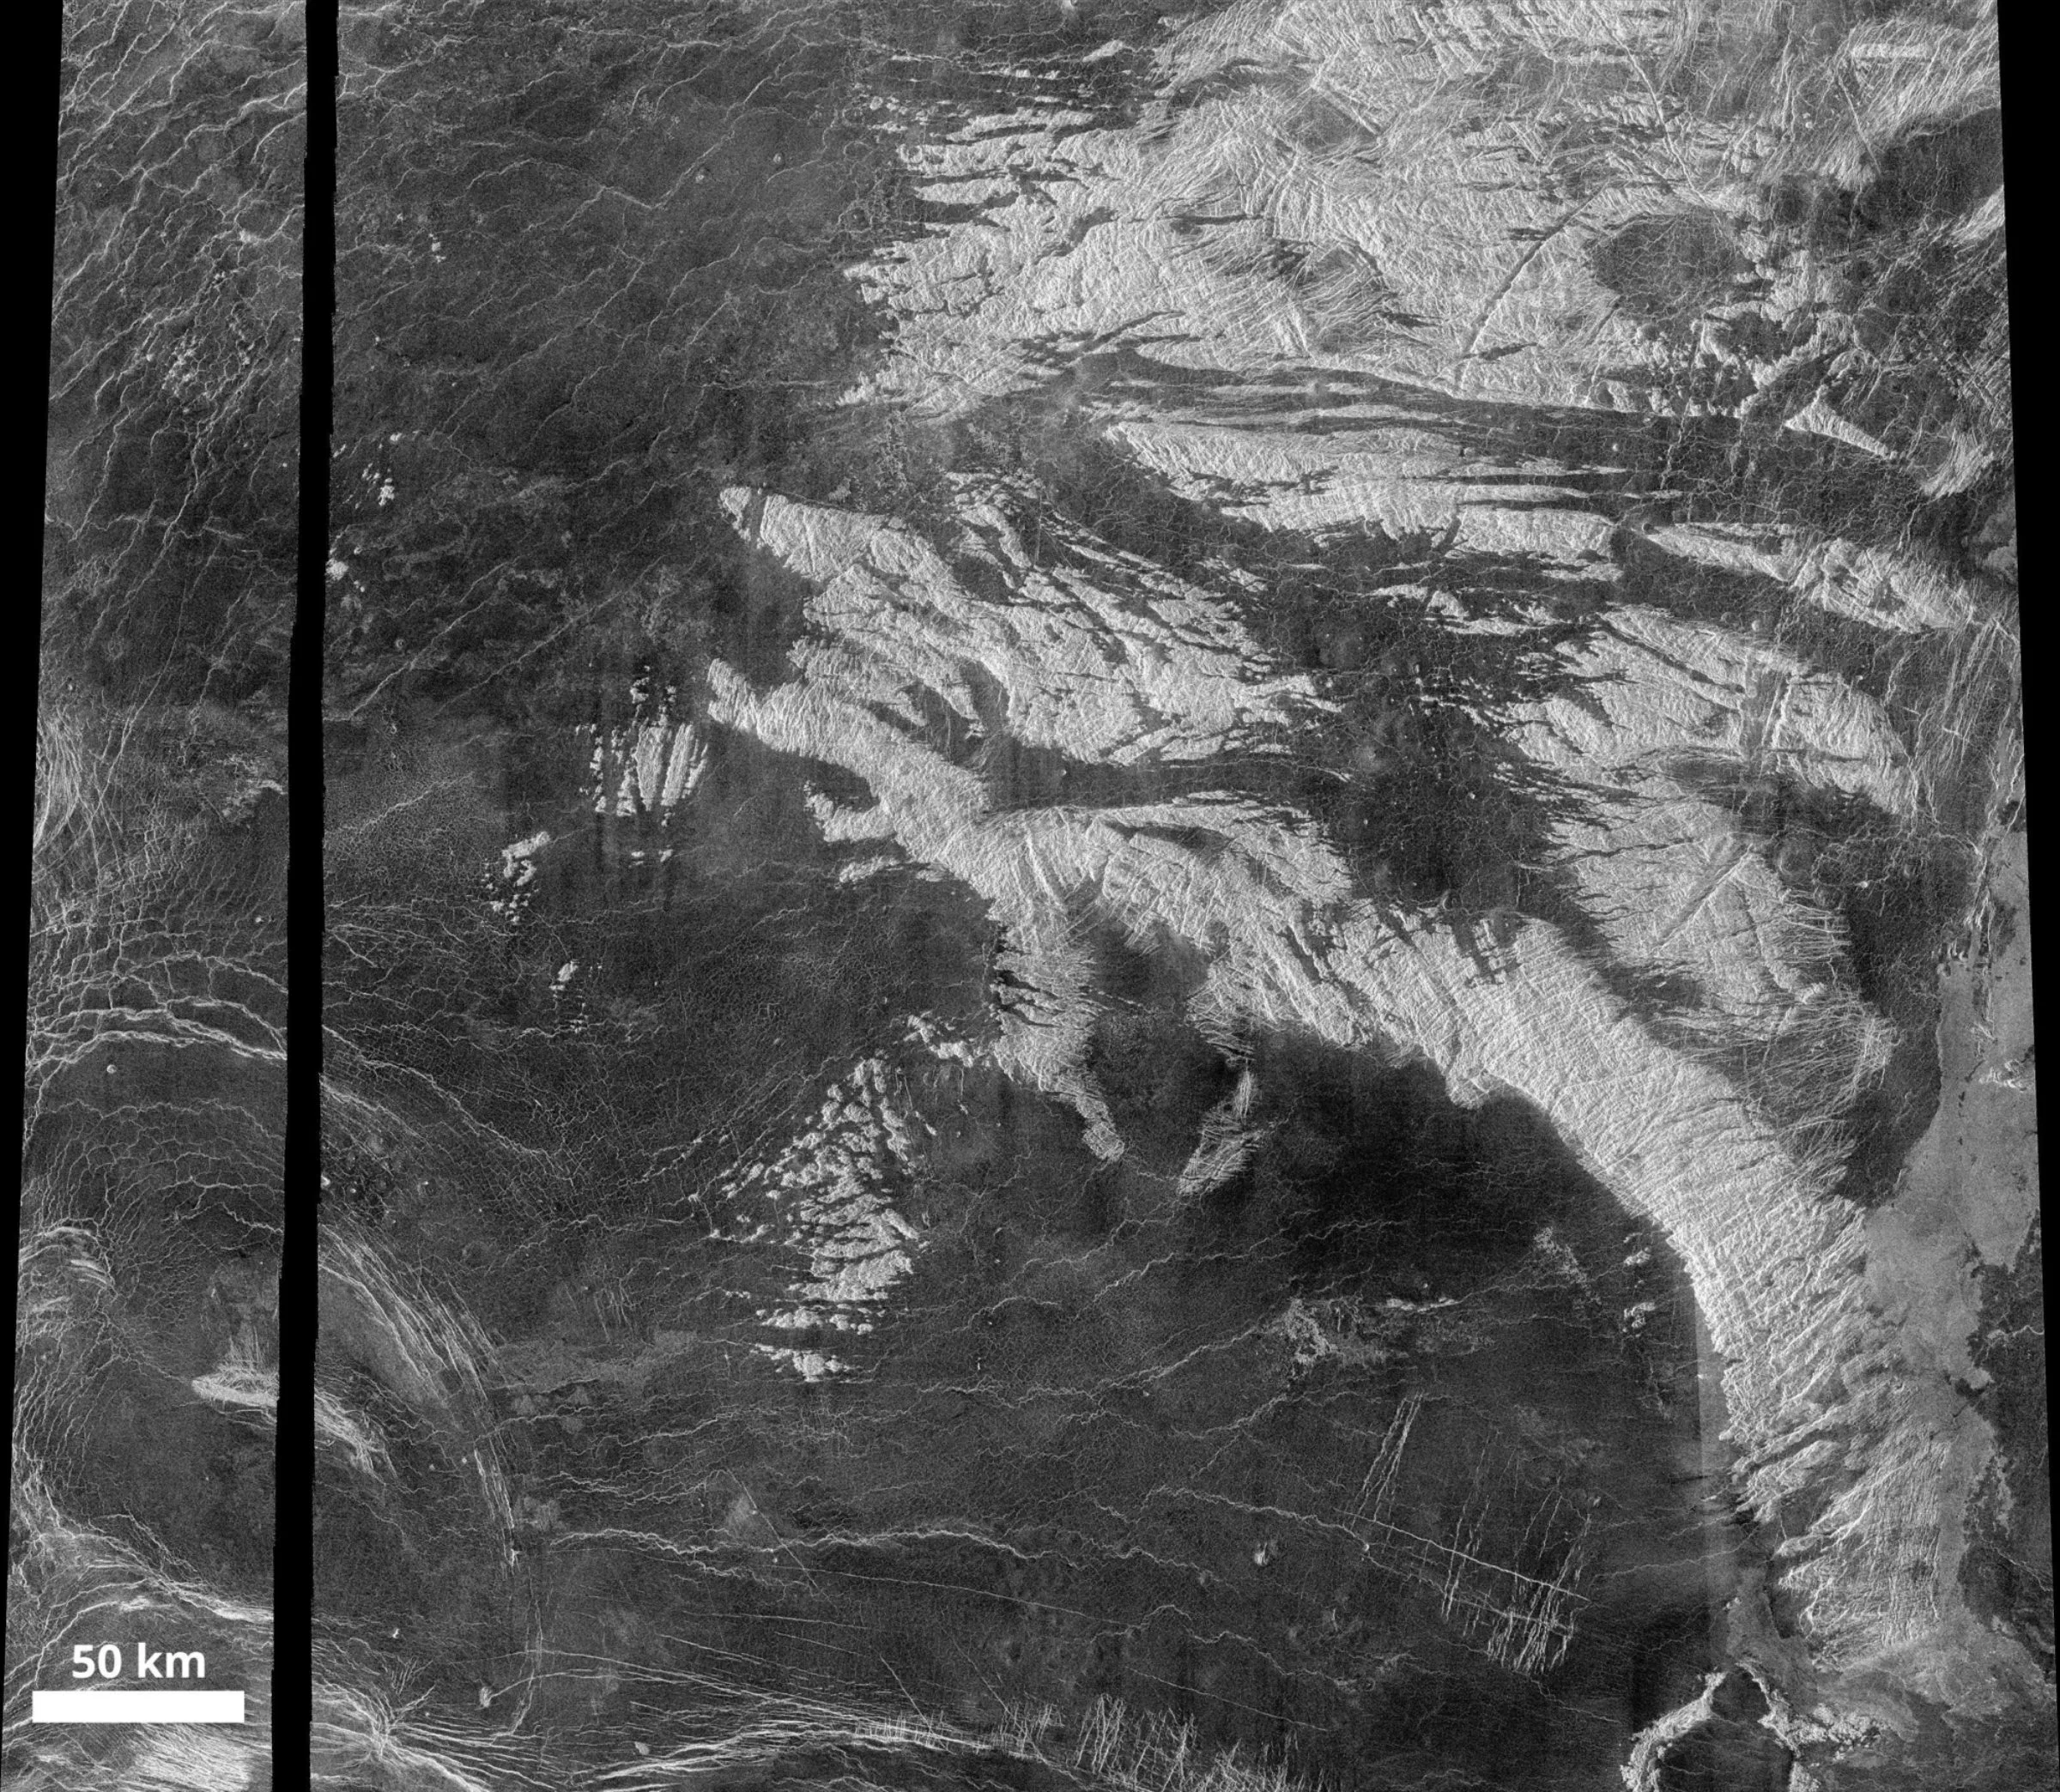
This is an area of Venus located southeast of Fortuna Tessera. The bright, rough terrain is “tessera”; the dark material between it is smoother lava plains. The plains are cut by polygonal cracks and folded by wrinkle ridges. Plains lavas have flowed into linear cracks in the tessera, indicating that the plains lavas came after the tessera.Image: NASA / JPL / mapaplanet.org / Emily Lakdawalla
Venus Landforms - Volcanoes
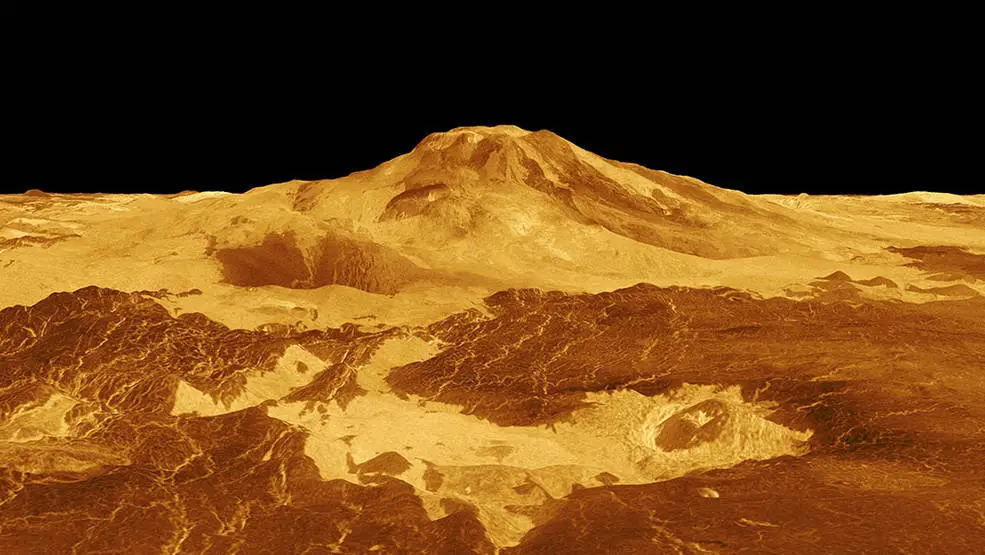
Maat Mons: computer generated 3D perspective of the surface of Venus. The viewpoint is located ~640 km north of Maat Mons at an elevation of ~3 km above the terrain. Lava flows extend for hundreds of kilometers across the fractured plains shown in the foreground, to the base of Maat Mons. (Image credit: NASA/JPL-Caltech)
Venus Landforms - Active Volcanoes
Radar images of a vent that has changed shape. (A) East-looking cycle 1 image and (B) west-looking cycle 2 image of the changed vent and its surroundings. In the cycle 1 image, the vent appears nearly circular and deep with steep walls. In the cycle 2 image, the vent appears larger, irregular in outline, shallower, and nearly filled. The dashed yellow line outlines radar-bright lava flows visible in the cycle 2 image that were not apparent in the cycle 1 image.
Venus Landforms - Coronae

This Magellan image is centered on 30 degrees south latitude, 135 degrees east longitude, spans 3500 kilometers from east to west (left to right), and shows the near-circular trough of Artemis Chasma. Its circular shape and size (2100 km in diameter) make Artemis the largest corona identified to date on the surface of Venus.
Mars Landforms - Volcanoes
Olympus Mons (left), the largest volcano in the Tharsis region (right) and, we believe, the largest volcano in the solar system
Mars Landforms - Tectonic Rifting
ESA’s Mars Express High Resolution Stereo Camera (HRSC) global colour mosaic of Mars. Image shows the canyon system Valles Marineris with annotated surface details: sulphate deposits, haze and fog, and cloud cover. This tectonic feature stretches more than 4000 km east-west and up to 700 km north-south, and is the biggest and most dramatic canyon system in the Solar System.
Mars Landforms - Landslides
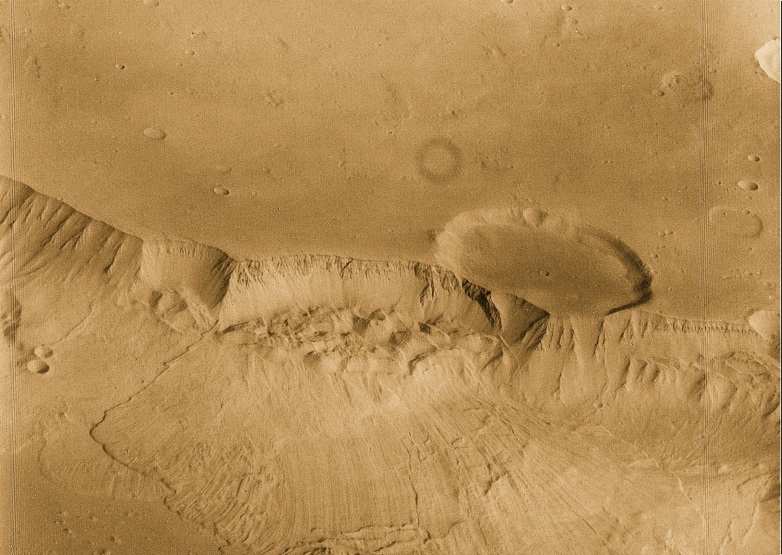
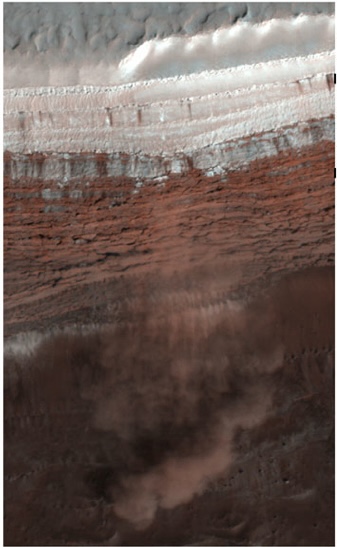
(Left) Lobate flows / landslides from a Martian scarp. (Right)A Mars Avalanche, taken by NASAs HiRISE instrument on the Mars Reconnaisance Orbiter (Credit: NASA/HiRISE)
Mars Landforms - Sand Dunes
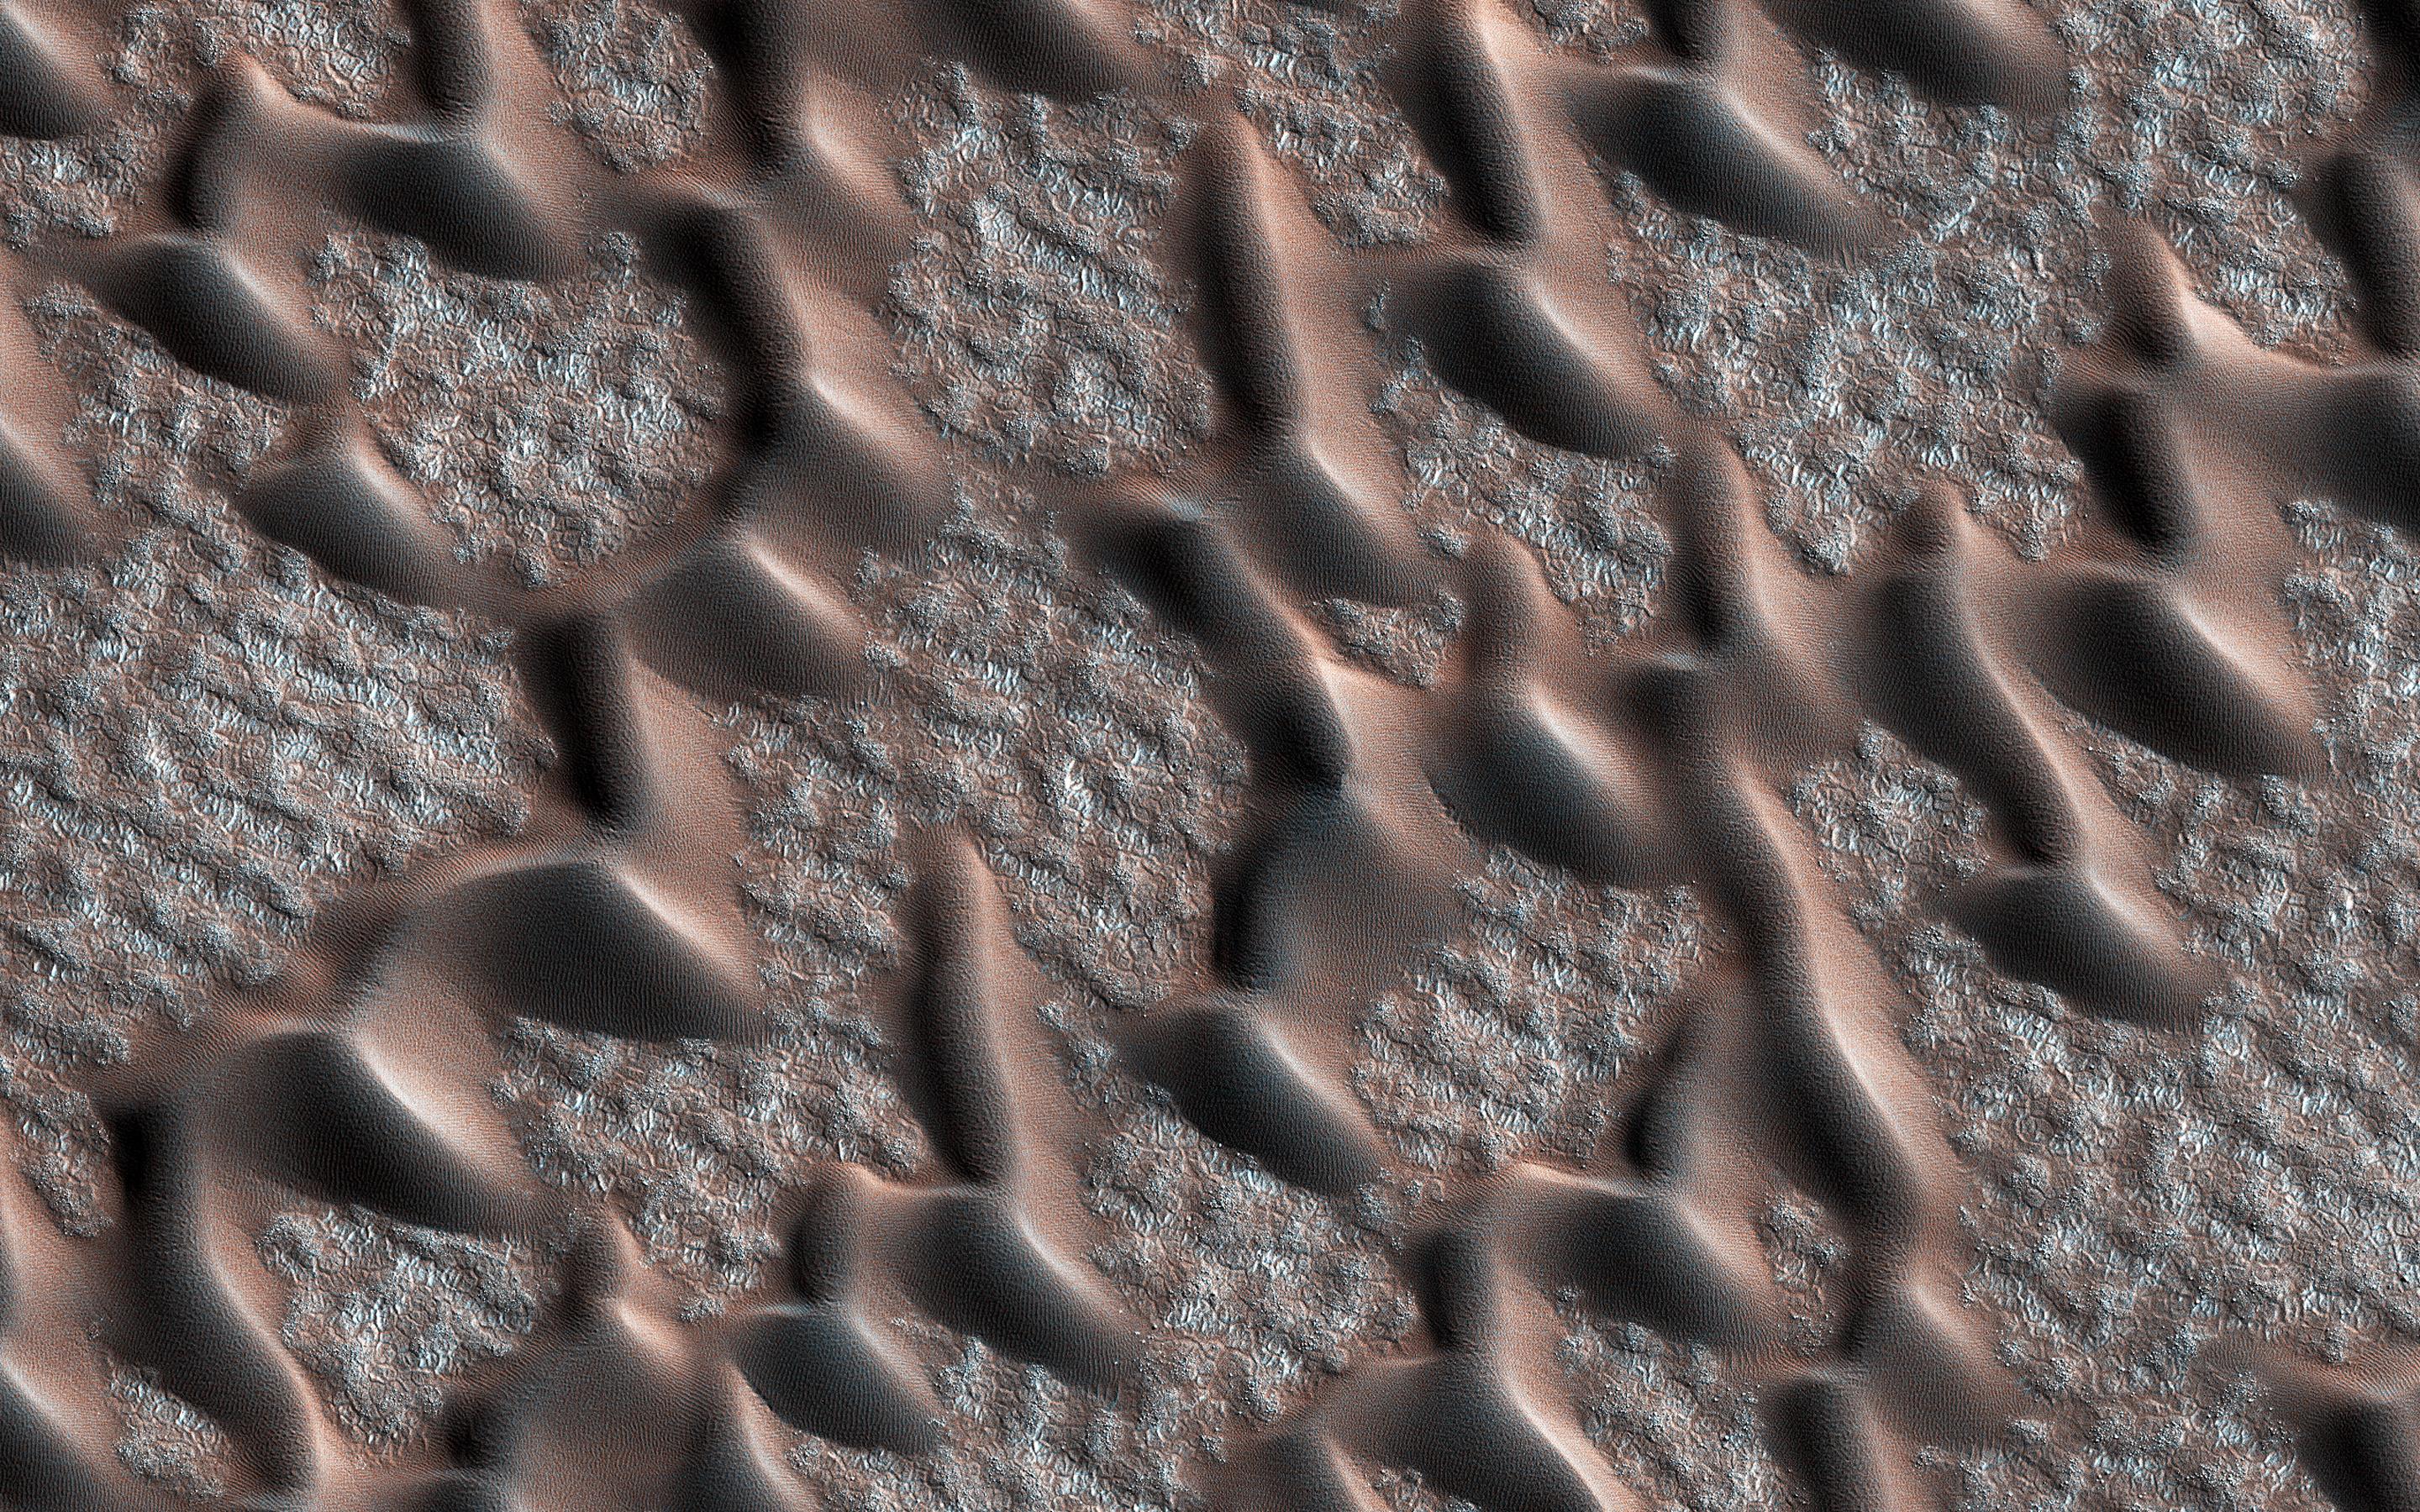
This image from NASA’s Mars Reconnaissance Orbiter (MRO) shows the permanent polar cap of Mars, encircled by sand dunes and looking like pulled threads, these dunes march across a fabric of patterned ground.
Mars Landforms - Ancient Rivers
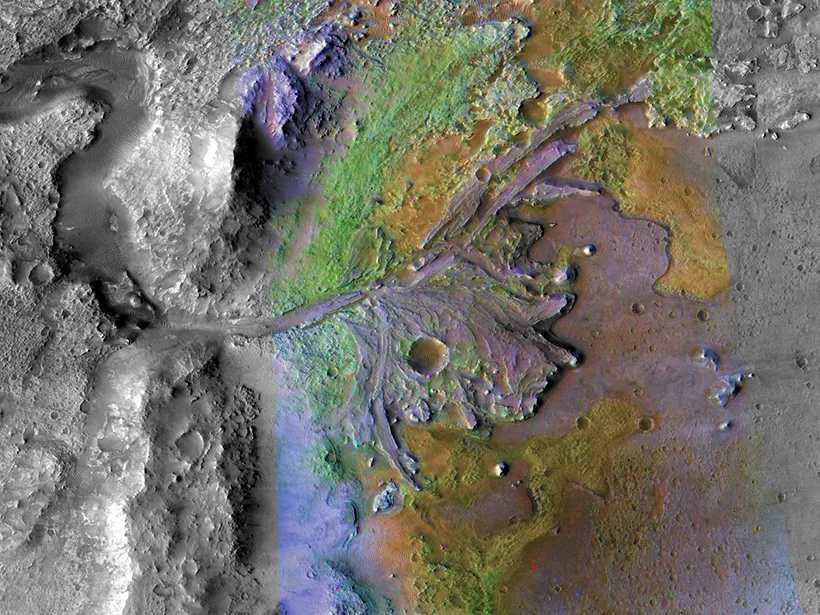
The grooved channels of an ancient river delta thread through Jezero crater on Mars. Credit: NASA/JPL-Caltech/MSSS/JHUAPL
Less that 1 Gyr ago, there was liquid water flowing across Mars. This has significant implications for atmospheric pressure and temperature at that time.
Duncombe, J. (2019), What ancient rivers on Mars reveal about its “great drying”, Eos, 100, https://doi.org/10.1029/2019EO119487. Published on 27 March 2019.
Mars Landforms - Ancient Rivers (2)
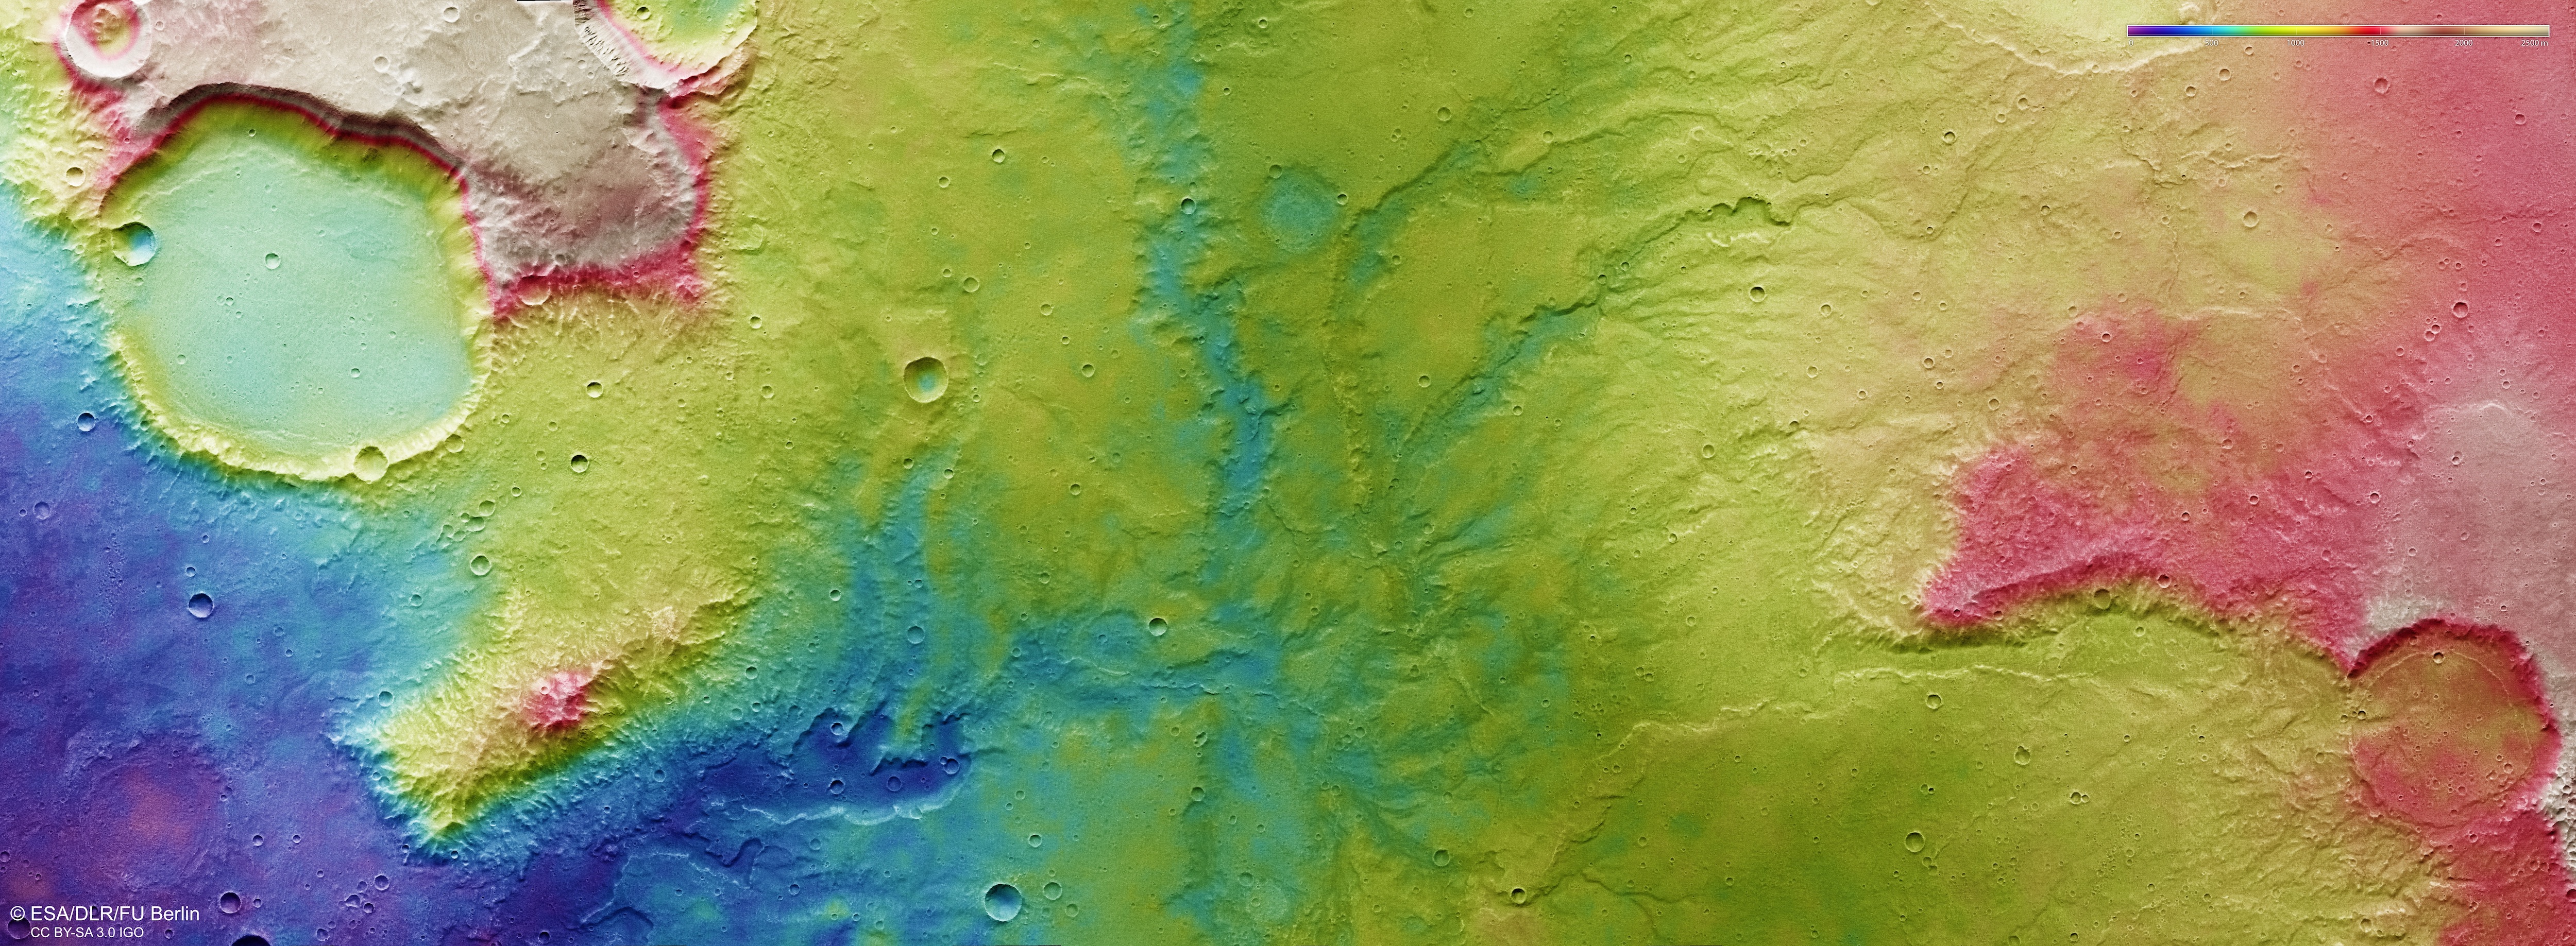
*This colour-coded topographic view shows the relative heights of the terrain in and around a network of dried-up valleys on Mars.
Lower parts of the surface are shown in blues and purples, while higher altitude regions show up in whites, yellows, and reds, as indicated on the scale to the top right. This view is based on a digital terrain model of the region, from which the topography of the landscape can be derived. It comprises data obtained by the High Resolution Stereo Camera on Mars Express on 19 November 2018 during Mars Express orbit 18831. Credit:ESA/DLR/FU Berlin*
Mars Landforms - Evidence of Groundwater
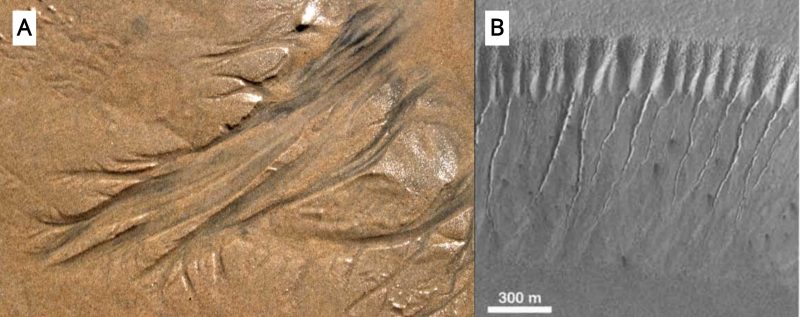
A) Beach drainage pattern on the order of 1 meter (Source: https://epod.usra.edu/blog/2017/01/beach-drainage.html), B) Martian “alcoves” suggesting groundwater seepage.
Mars Landforms - Evidence of Groundwater (2)
This animationshows warm-season features that might be evidence of salty liquid water active on Mars today. Evidence for that possible interpretation is presented in a report by McEwen et al. in the Aug. 5, 2011, edition of Science.
Mercury - Evidence of Cooling and Contraction
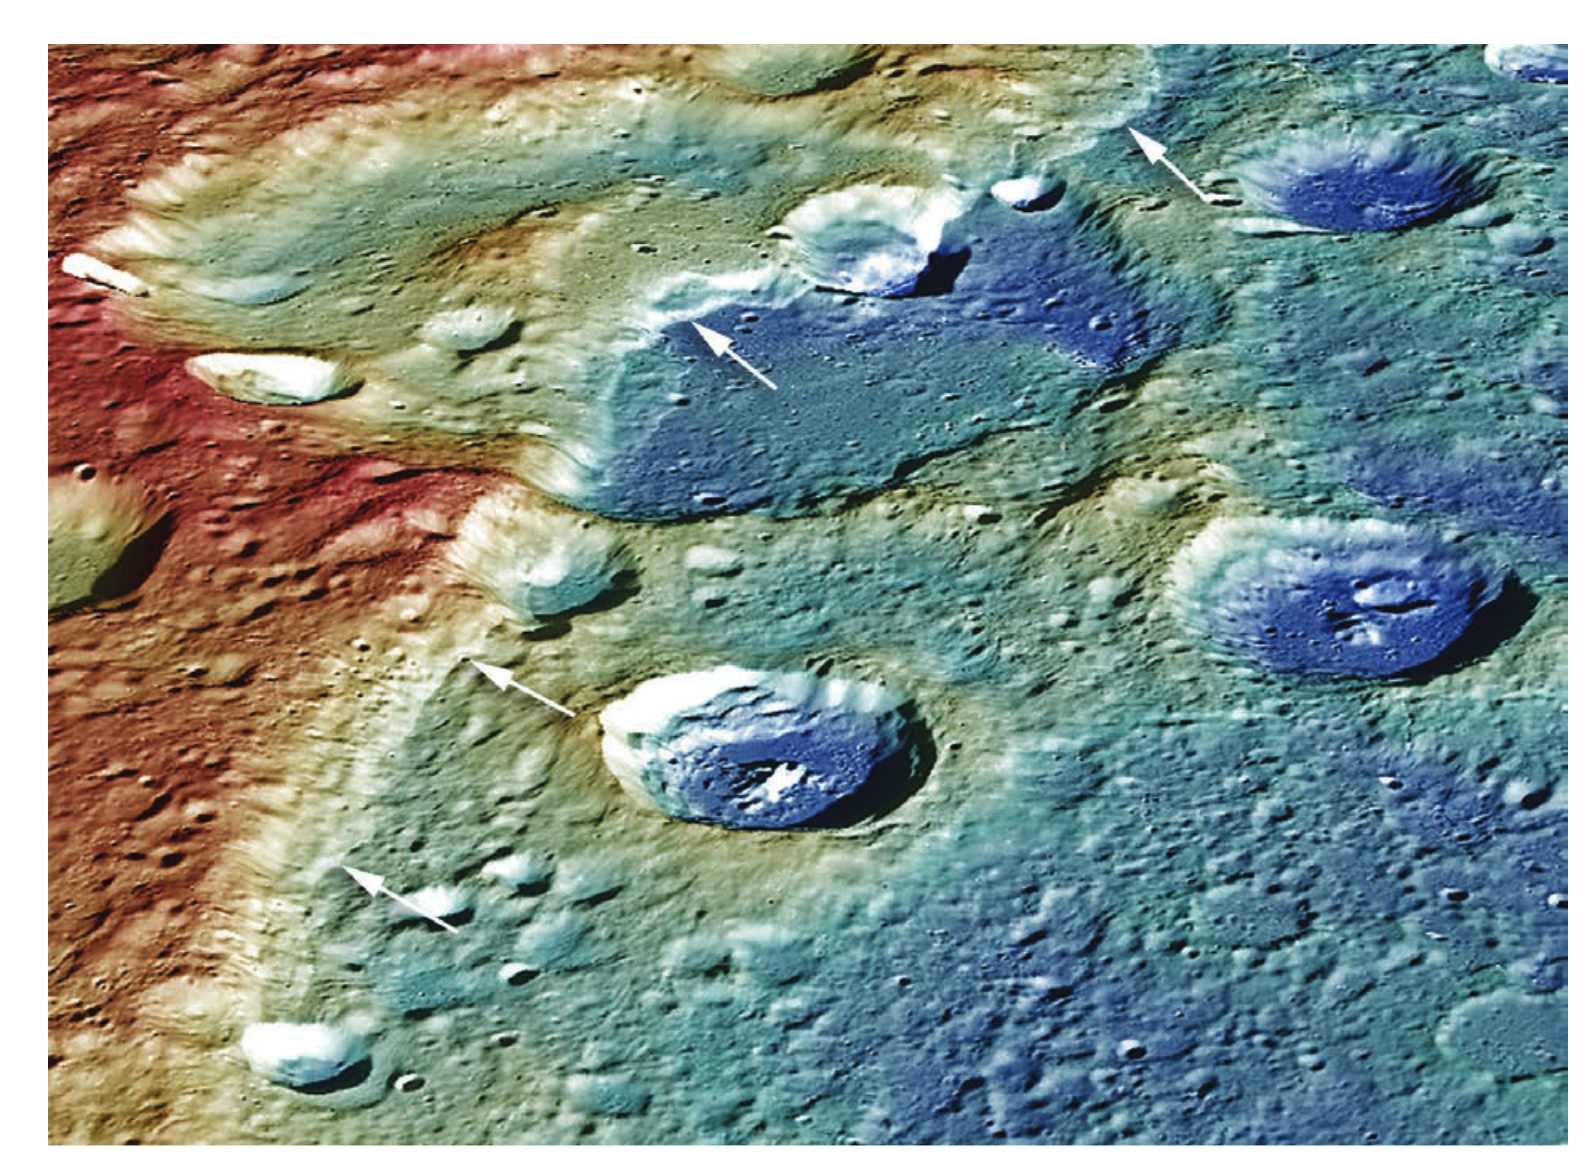
Giant tectonic landforms like Carnegie Rupes, which is more than 2 km high in places, provide evidence that Mercury shrunk as it cooled, creating a lobate scarp (arrowed). The image has been color-coded to indicate differences in topography: regions in red are higher standing terrain, regions in blue lower. SOURCE: Courtesy of NASA/Johns Hopkins University/Carnegie Institution of Washington
Mercury, a Cratered / Impacted Body


Caloris Basin (left) is one of the largest impact craters in the solar system (1500 km diameter). At the antipode is a region of “shocked terrain” (or “weird terrain” that may be due to re-focusing of the impact energy
The inner-solar system location of Mercury means that impacts have very high kinetic energy and lead to a highly cratered surface.
Mercury - Volatiles Near the Surface
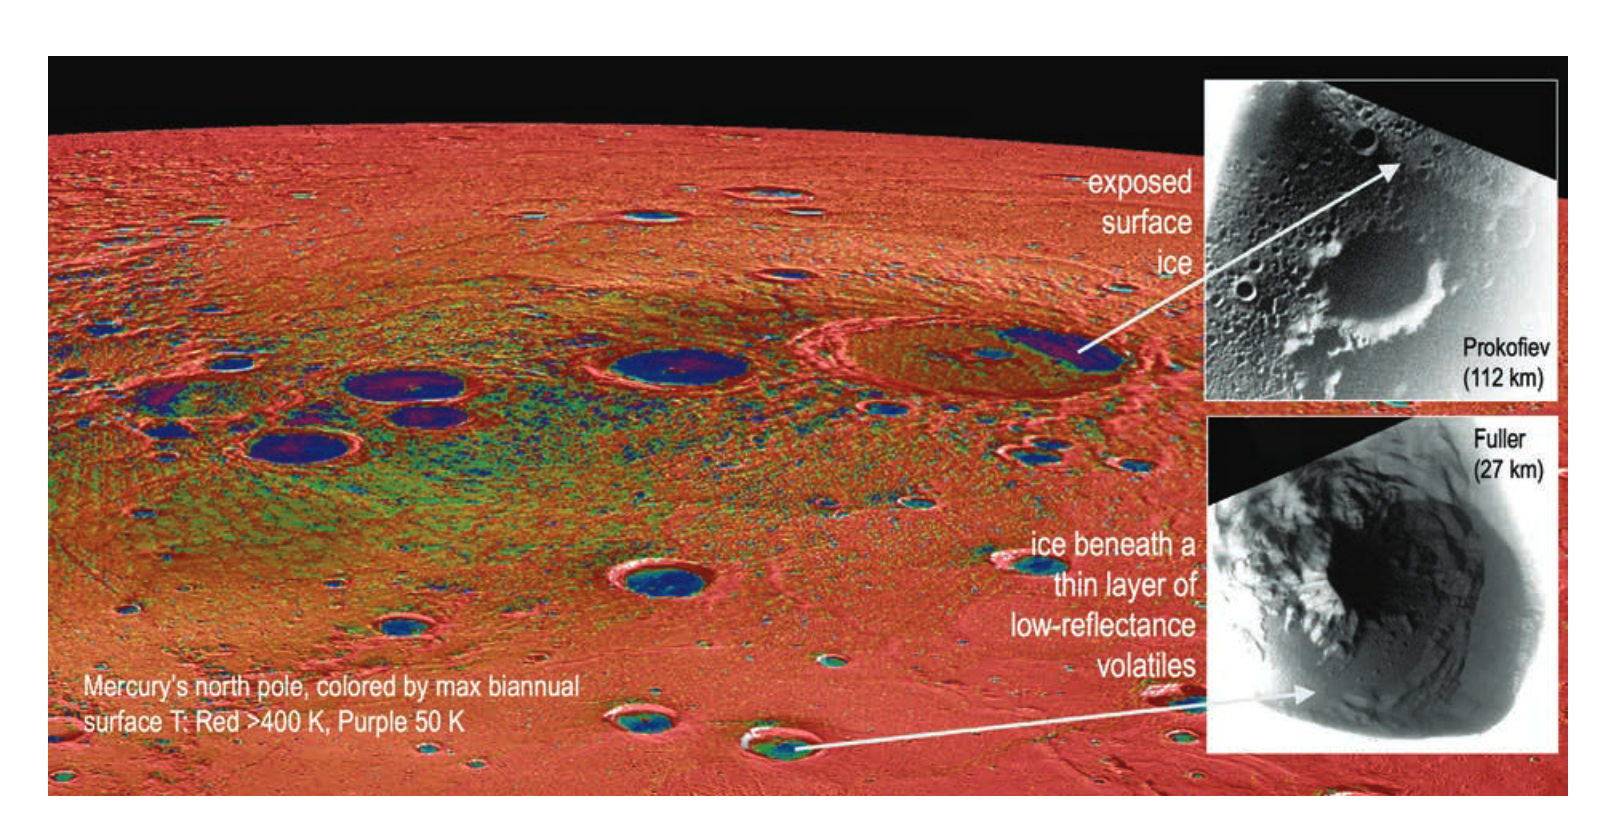
Despite their hot surroundings, permanently shadowed regions near Mercury’s poles stay cold enough to host abundant deposits of water ice. SOURCE: Courtesy of N.L. Chabot with MESSENGER data from NASA/Johns Hopkins University Applied Physics Laboratory/Carnegie Institution of Washington; and Armytage et al. (2018).
Earth’s Moon Surface Features: Craters
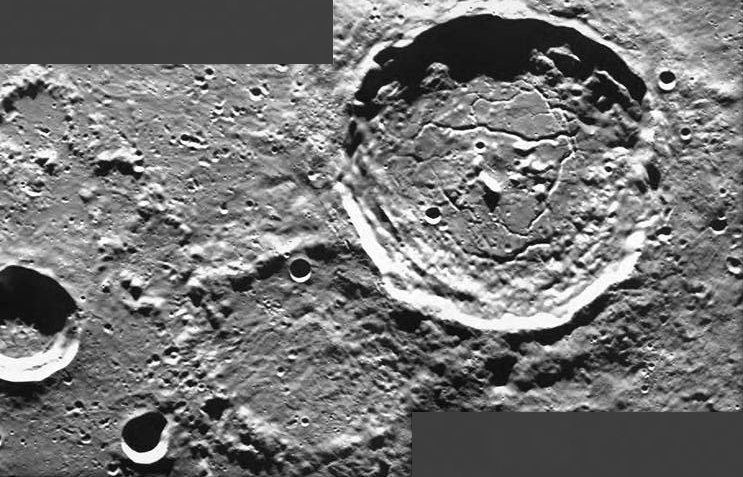
This image shows a crater-filled region in the northeastern part of the Moon. To the left of the frame is the small Keldysh crater. Below and to the right of Keldysh is the small depression of Hercules F, which sits to the left of the faint and eroded rim of Atlas E. The largest and most prominent feature, visible towards the top right of the frame, is Atlas crater.
Atlas is ~2km deep and ~90 km in diameter. The crater floor is peppered with hills, rifts and fractures that surround a clearly visible central mountain (seen casting a shadow). Some of the crater’s features are thought to have been influenced or shaped by volcanism e.g. the branching web of deep fissures and cracks stretching throughout the crater, known as Rimae Atlas. (ESA)
Earth’s Moon Surface Features: Maria
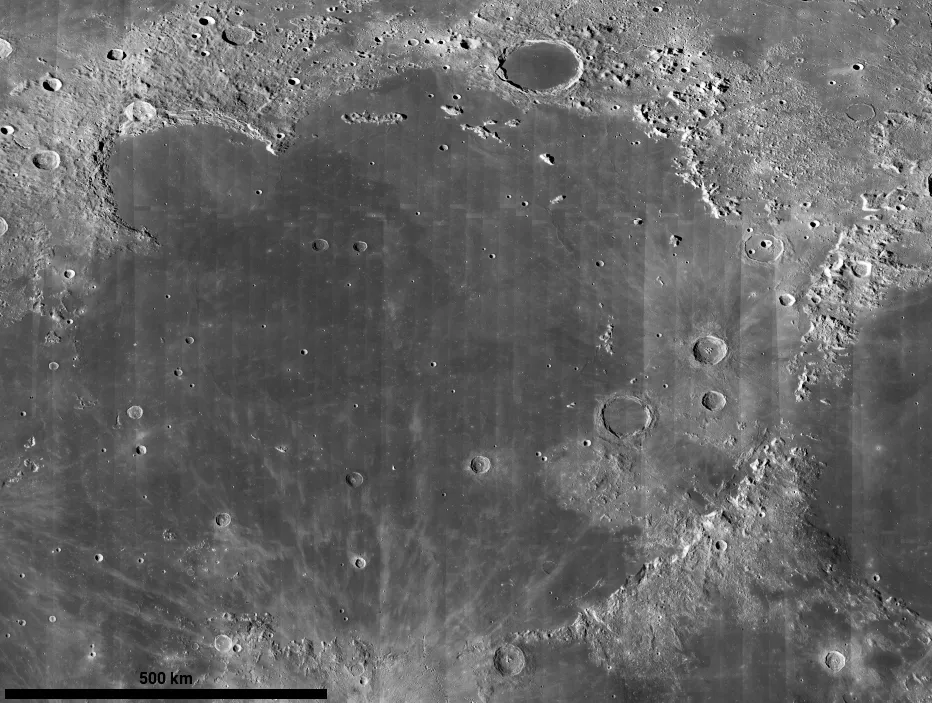

Left: Mare Imbrium. The largest basin at over 1100km diameter. The basin is surrounded by a ring of mountains, rising up as much as 7km above the mare floor, and there are signs of ejecta radiating out as far as 800km. Right: Mare Ingenii. On the far side of the Moon, 300km diameter, and part of the South Pol-Aitken basin. Swirls of light and dark volcanic material, the pattern of which may reflect the localised magnetic field of the region when it formed.
Lunar maria are the dark topographical features that can be observed on the lunar surface, covering about 15% of the Moon’s crust. They are impact basins created by collisions with cosmic debris that filled with lava and other lunar material between 1-4 billion years ago.
Unique Datasets for Planet Earth

Earth - Thickness of the Lithosphere
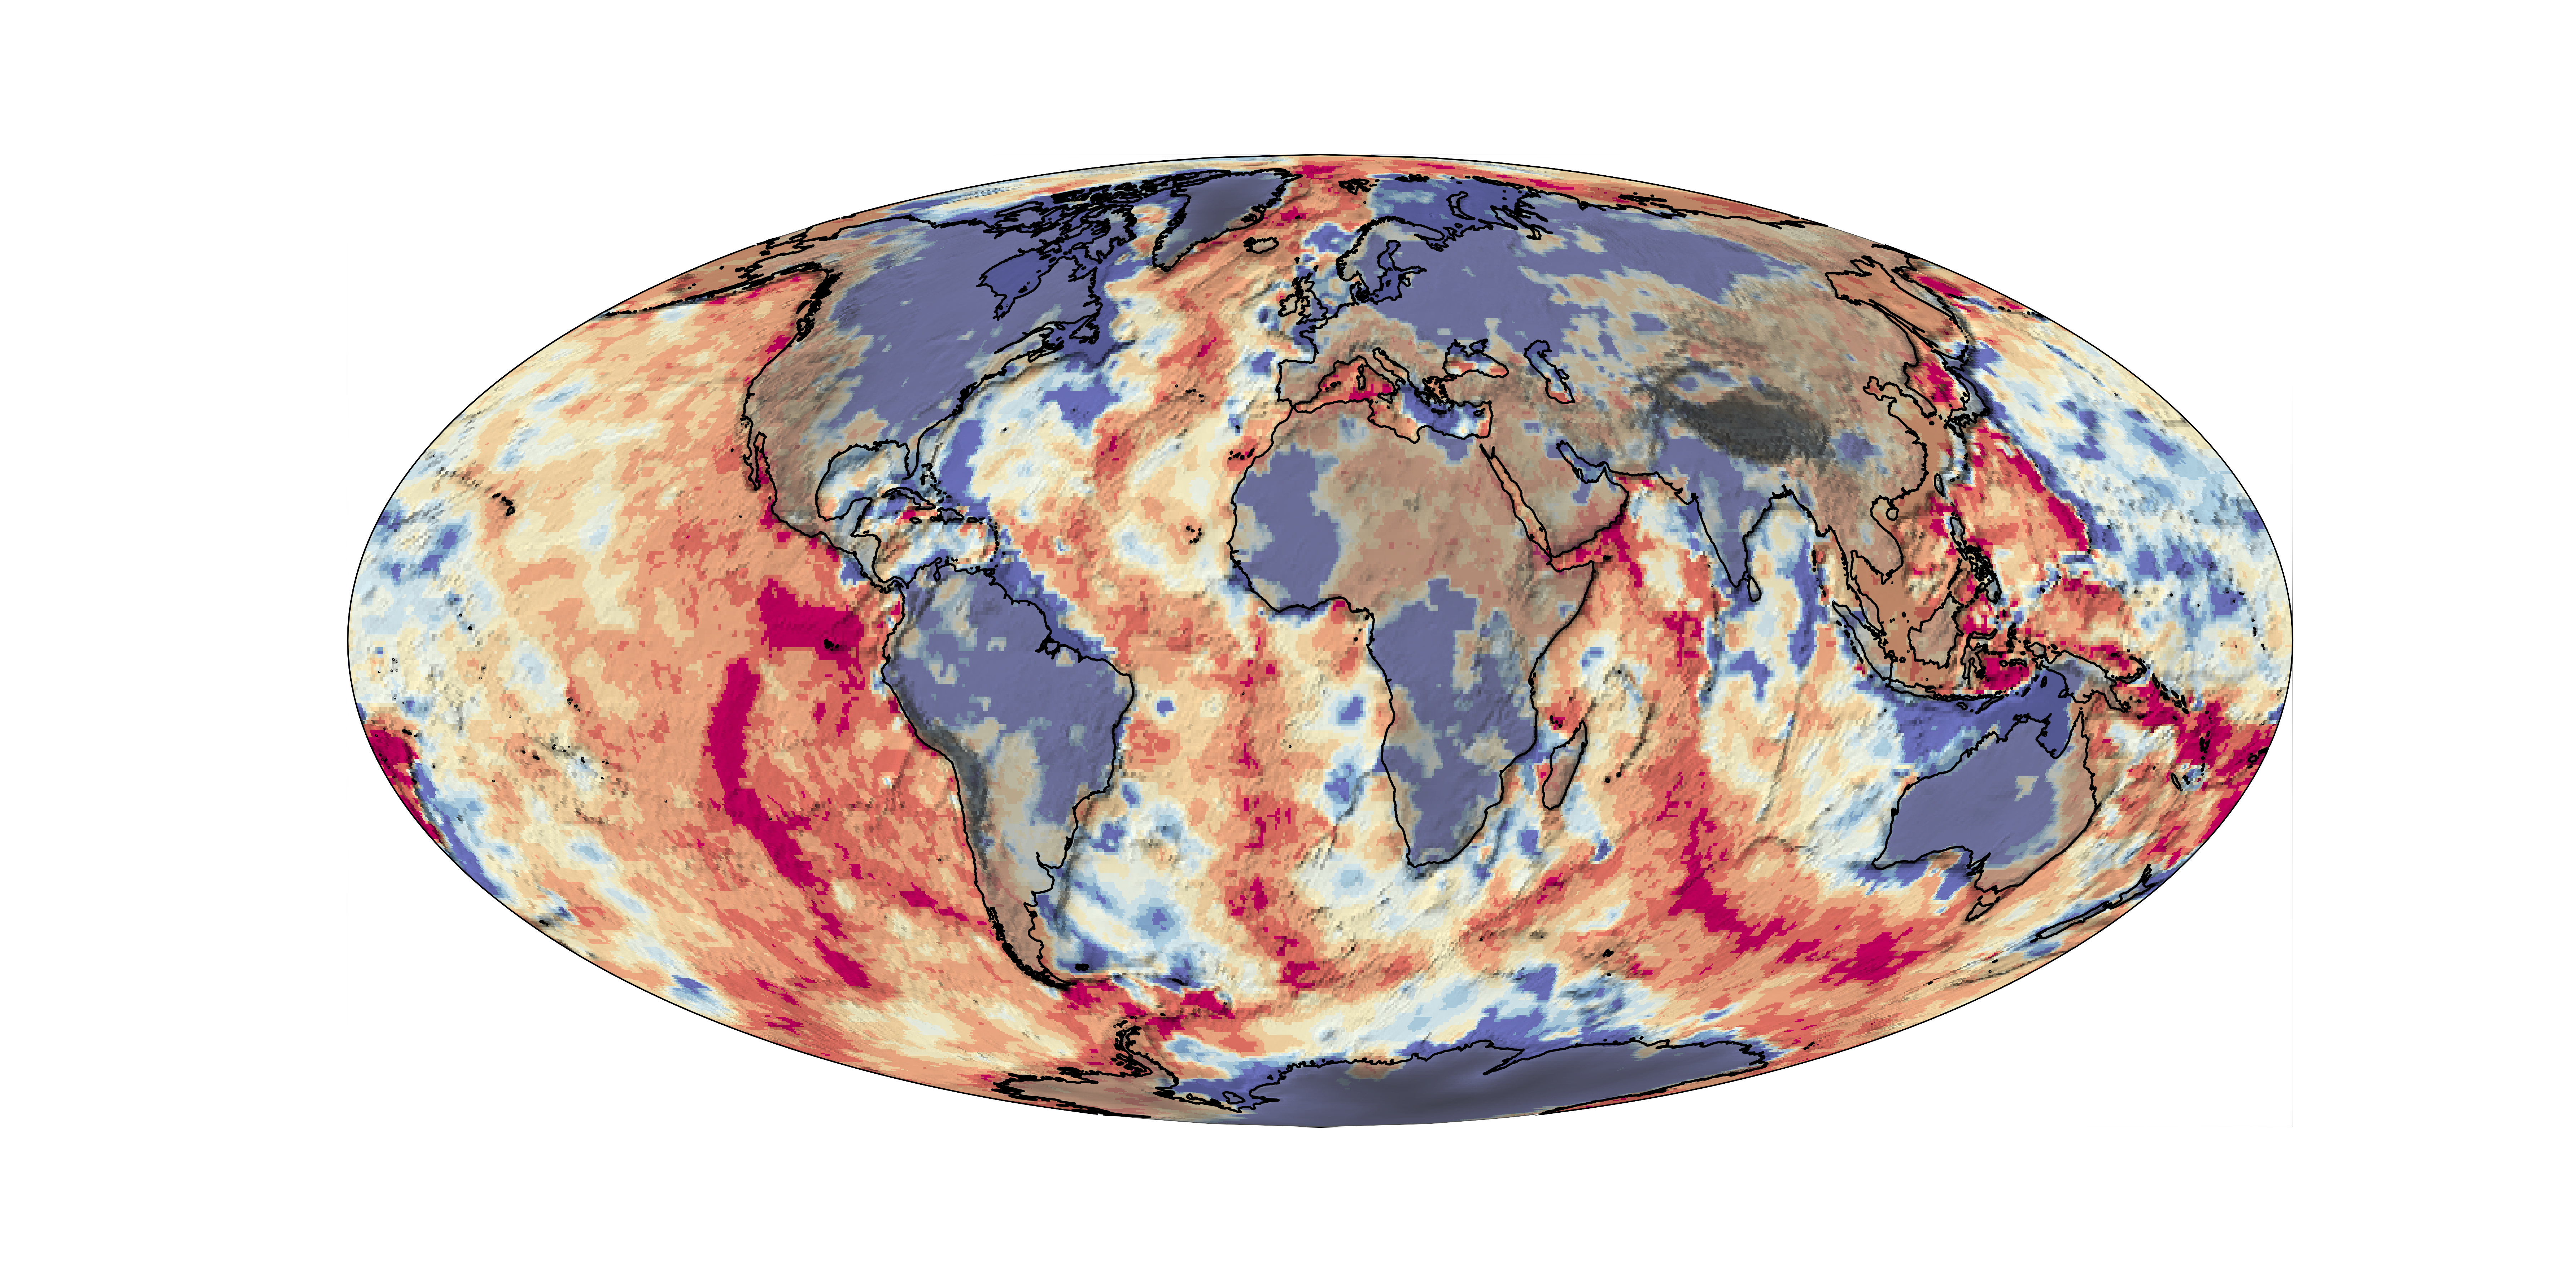
This map shows the lithospheric thickness coloured as though it refers to temperature (thin lithosphere is in warm colours, thick is in cool colours) which does have some physical relevance. The greyscale is topography.
Earth - Thickness of the Continental Lithosphere
A similar map that contours the thickest parts of the lithosphere (scale is in km) and leaves out the oceans altogether.
Earth - Relative thickness of Crust and Lithosphere

This map shows the relative thickness of the crust and the lithosphere (thick crust is dark). You can immediately see how important the mechanical structure of the lithosphere is when it comes to the response to geological stresses. The coloured dots are earthquake hypocentres coloured by depth and mostly show where the slabs are located.
Earth - Global Stress
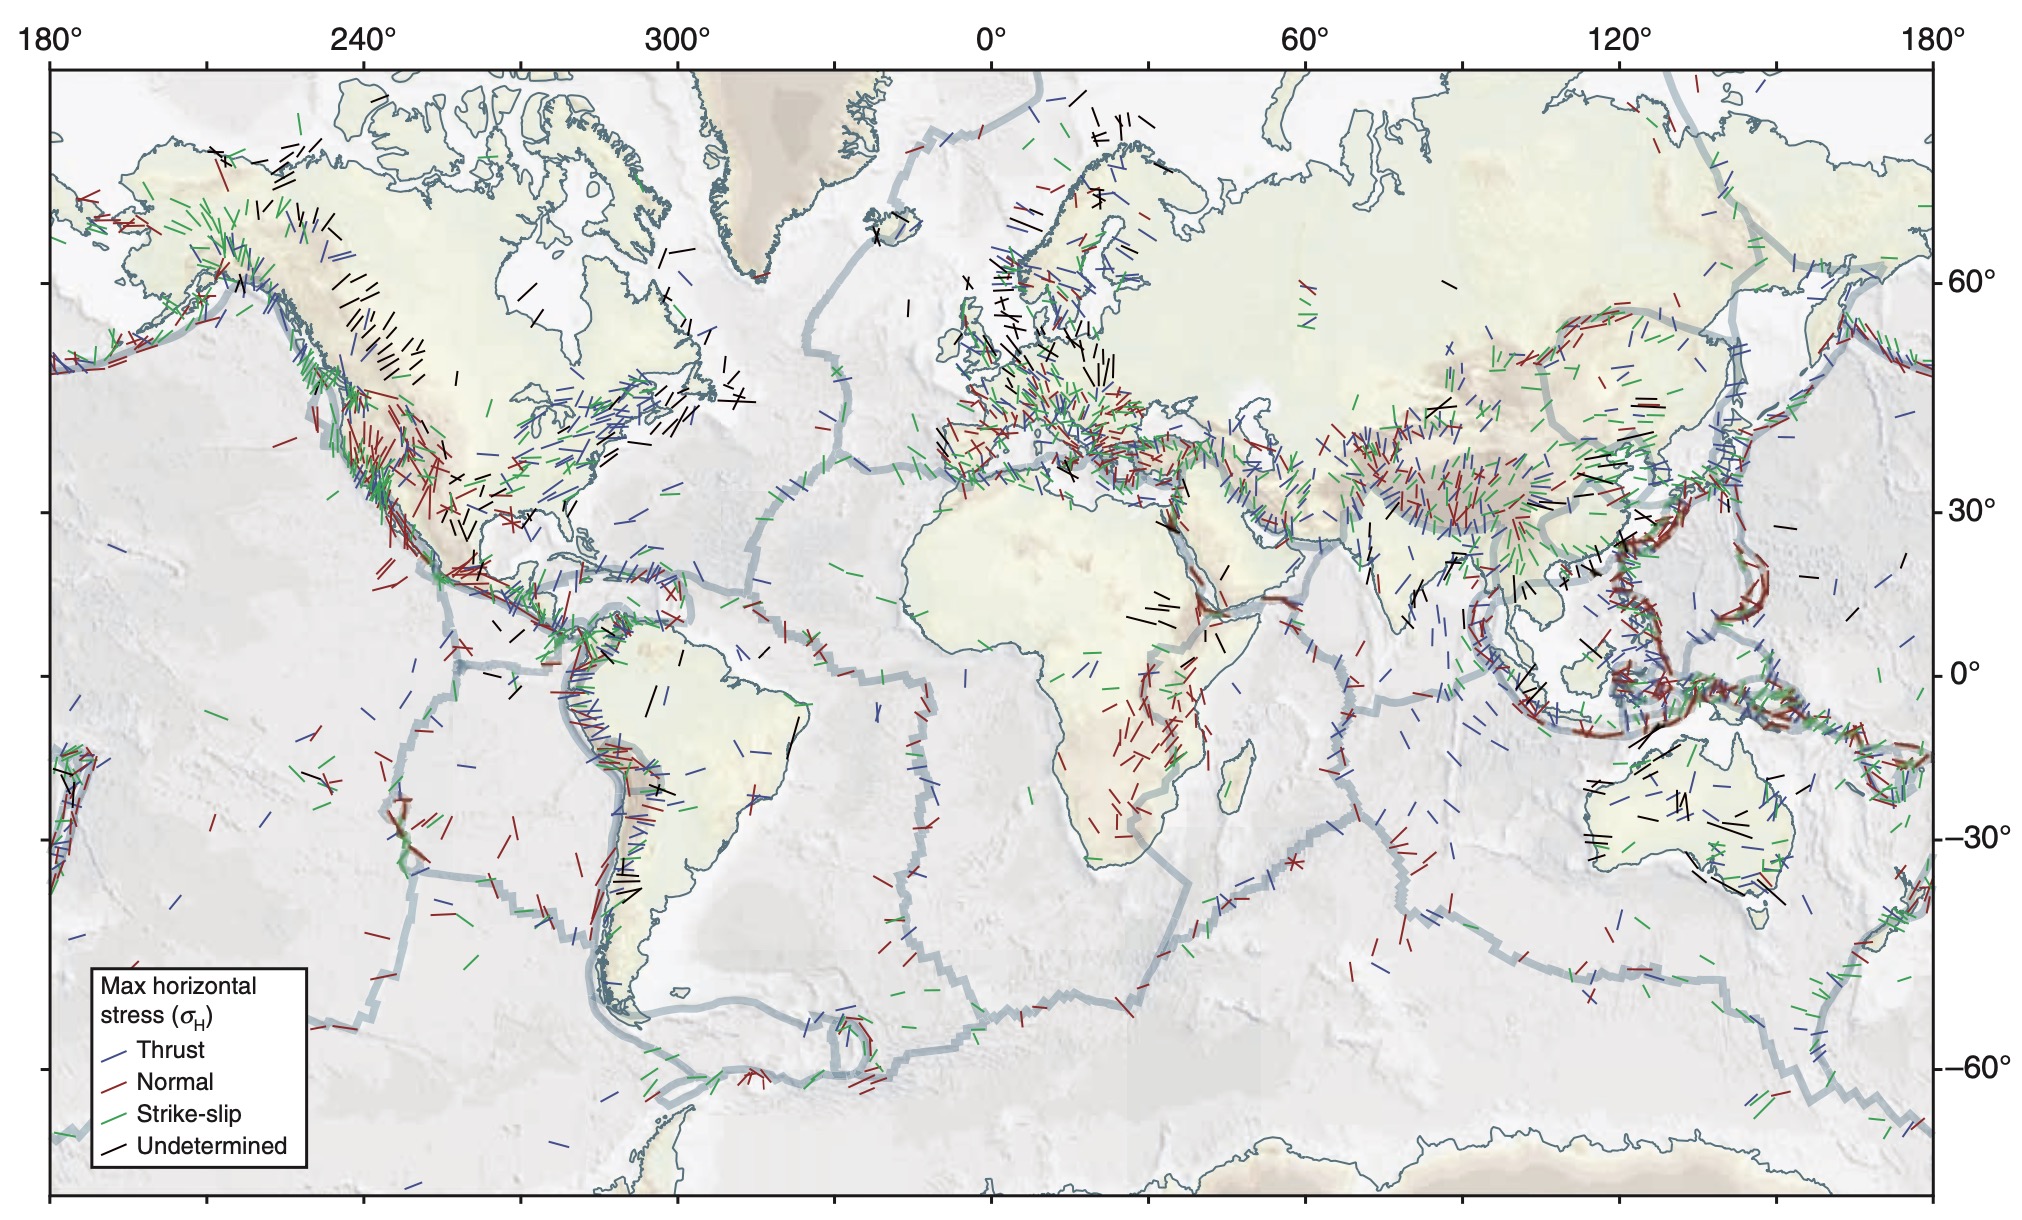
The World Stress Map (WSM) 2016 displays the contemporary crustal stress orientation in the upper 40 km based on the WSM database release 2016. Lines show the orientation of maximum horizontal stress. The colours indicate whether stresses are associated with a) Normal faulting, b) strike-slip faulting, or c) thrust faulting.Note that the magnitude of the stress is not part of this map.
Earth - Global Strain rate
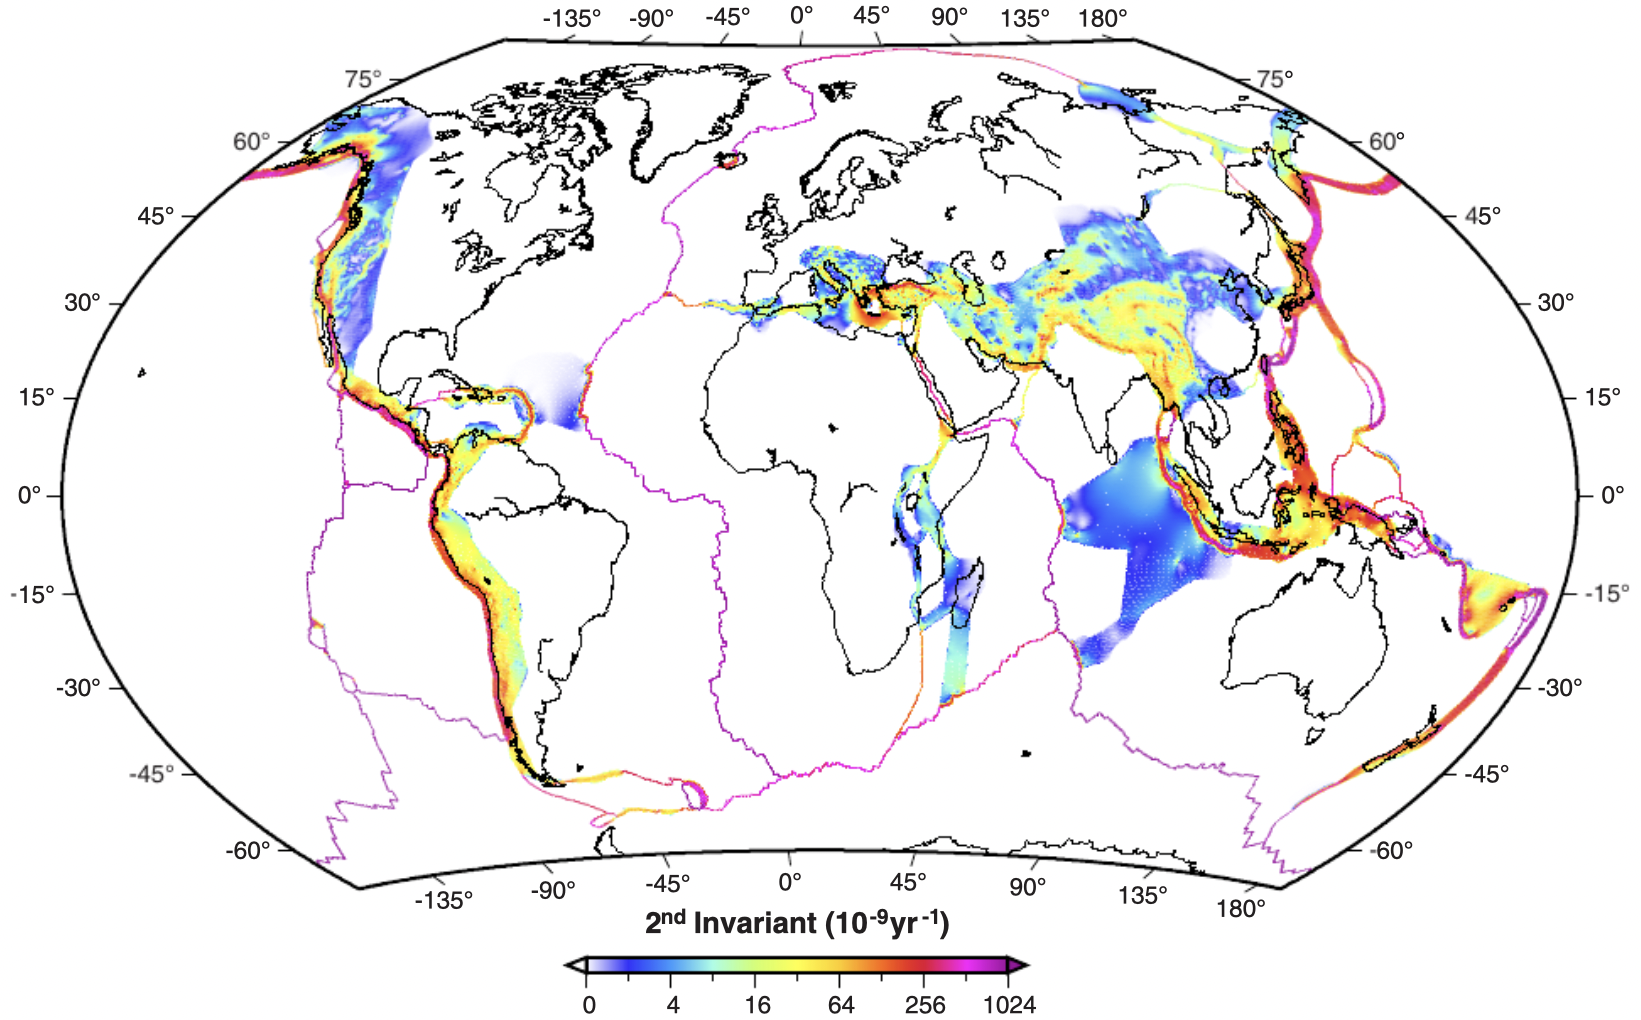
The strain rate is a measure of how fast deformation is taking place. Strain rate is a measure of the rate of change of length (units are \(s^{-1}\)) and it is a tensor: there are multiple components that represent normal and shear strains. The measure shown here is an average (the second invariant).
The rate of deformation is related to two things: the stress applied and the strength of the material.
Kreemer, C., Blewitt, G., & Klein, E. C. (2014). A geodetic plate motion and Global Strain Rate Model. Geochemistry, Geophysics, Geosystems, 15(10), 3849–3889. https://doi.org/10/f6p92p
Earth - Global Volcanism
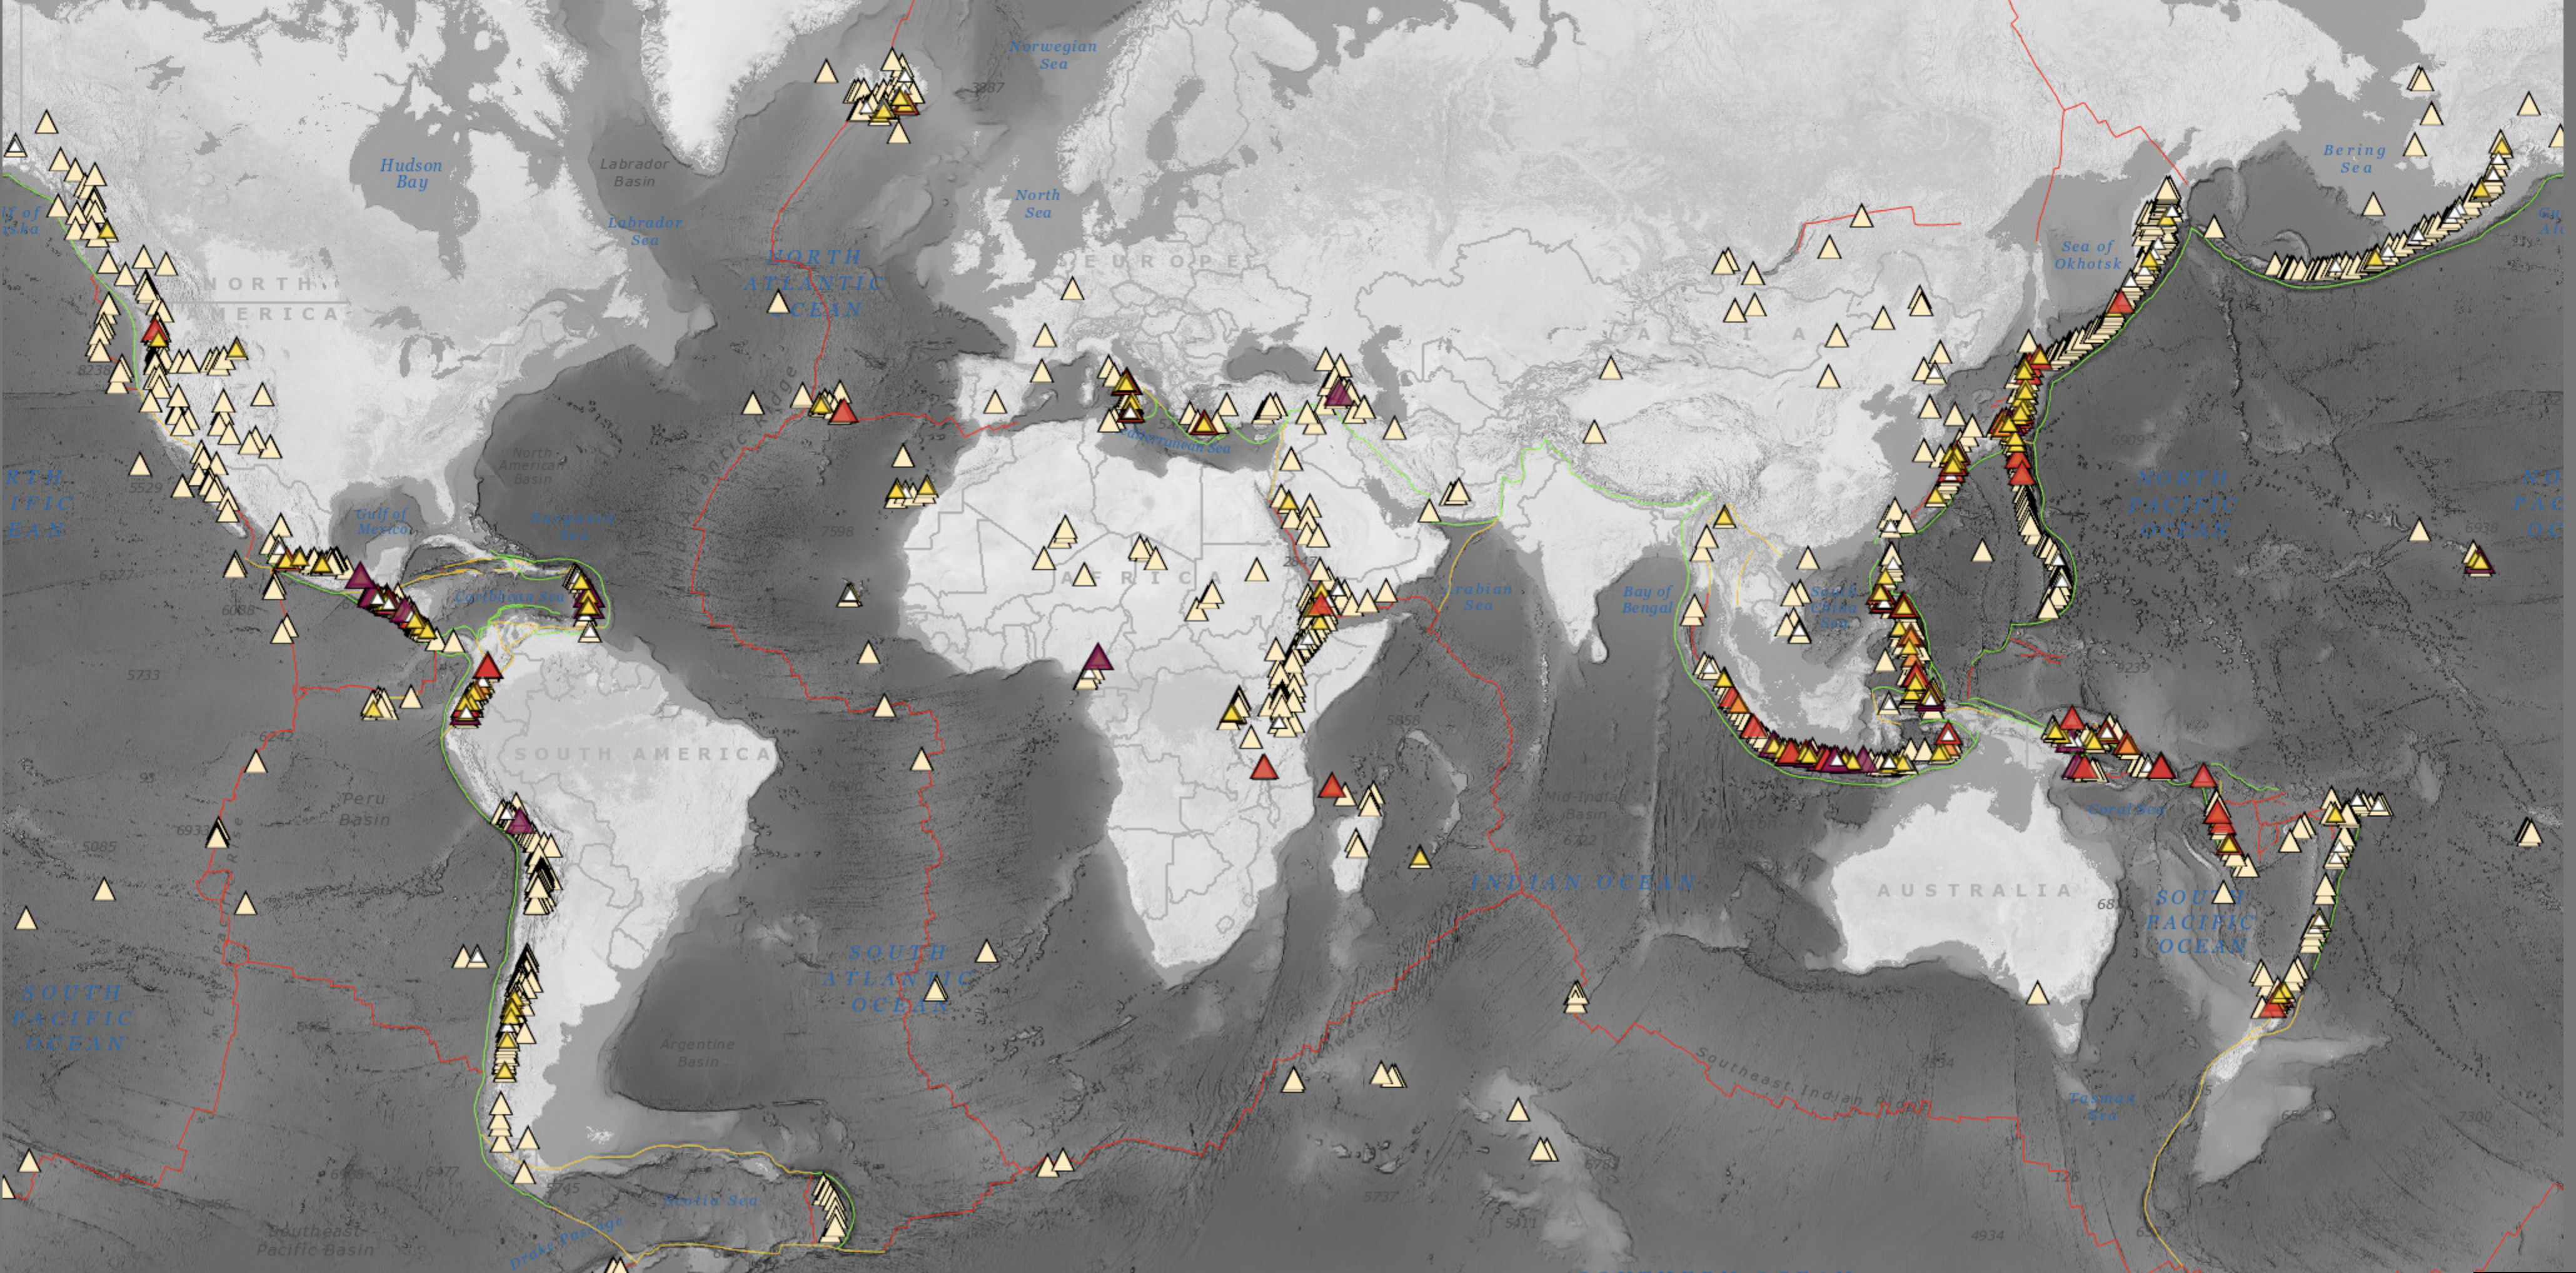
Volcanic activity is distributed similarly to that of seismicity and mostly occurs at convergent and divergent plate boundaries. There is also a significant level of intra-plate volcanism. Magma pathways within the crust are influenced by the stress field and we can analyse volcanic structures to determine the ambient stress field at the time they were formed.
Make your own map from the NOAA natural hazards interactive web page: https://maps.ngdc.noaa.gov/viewers/hazards
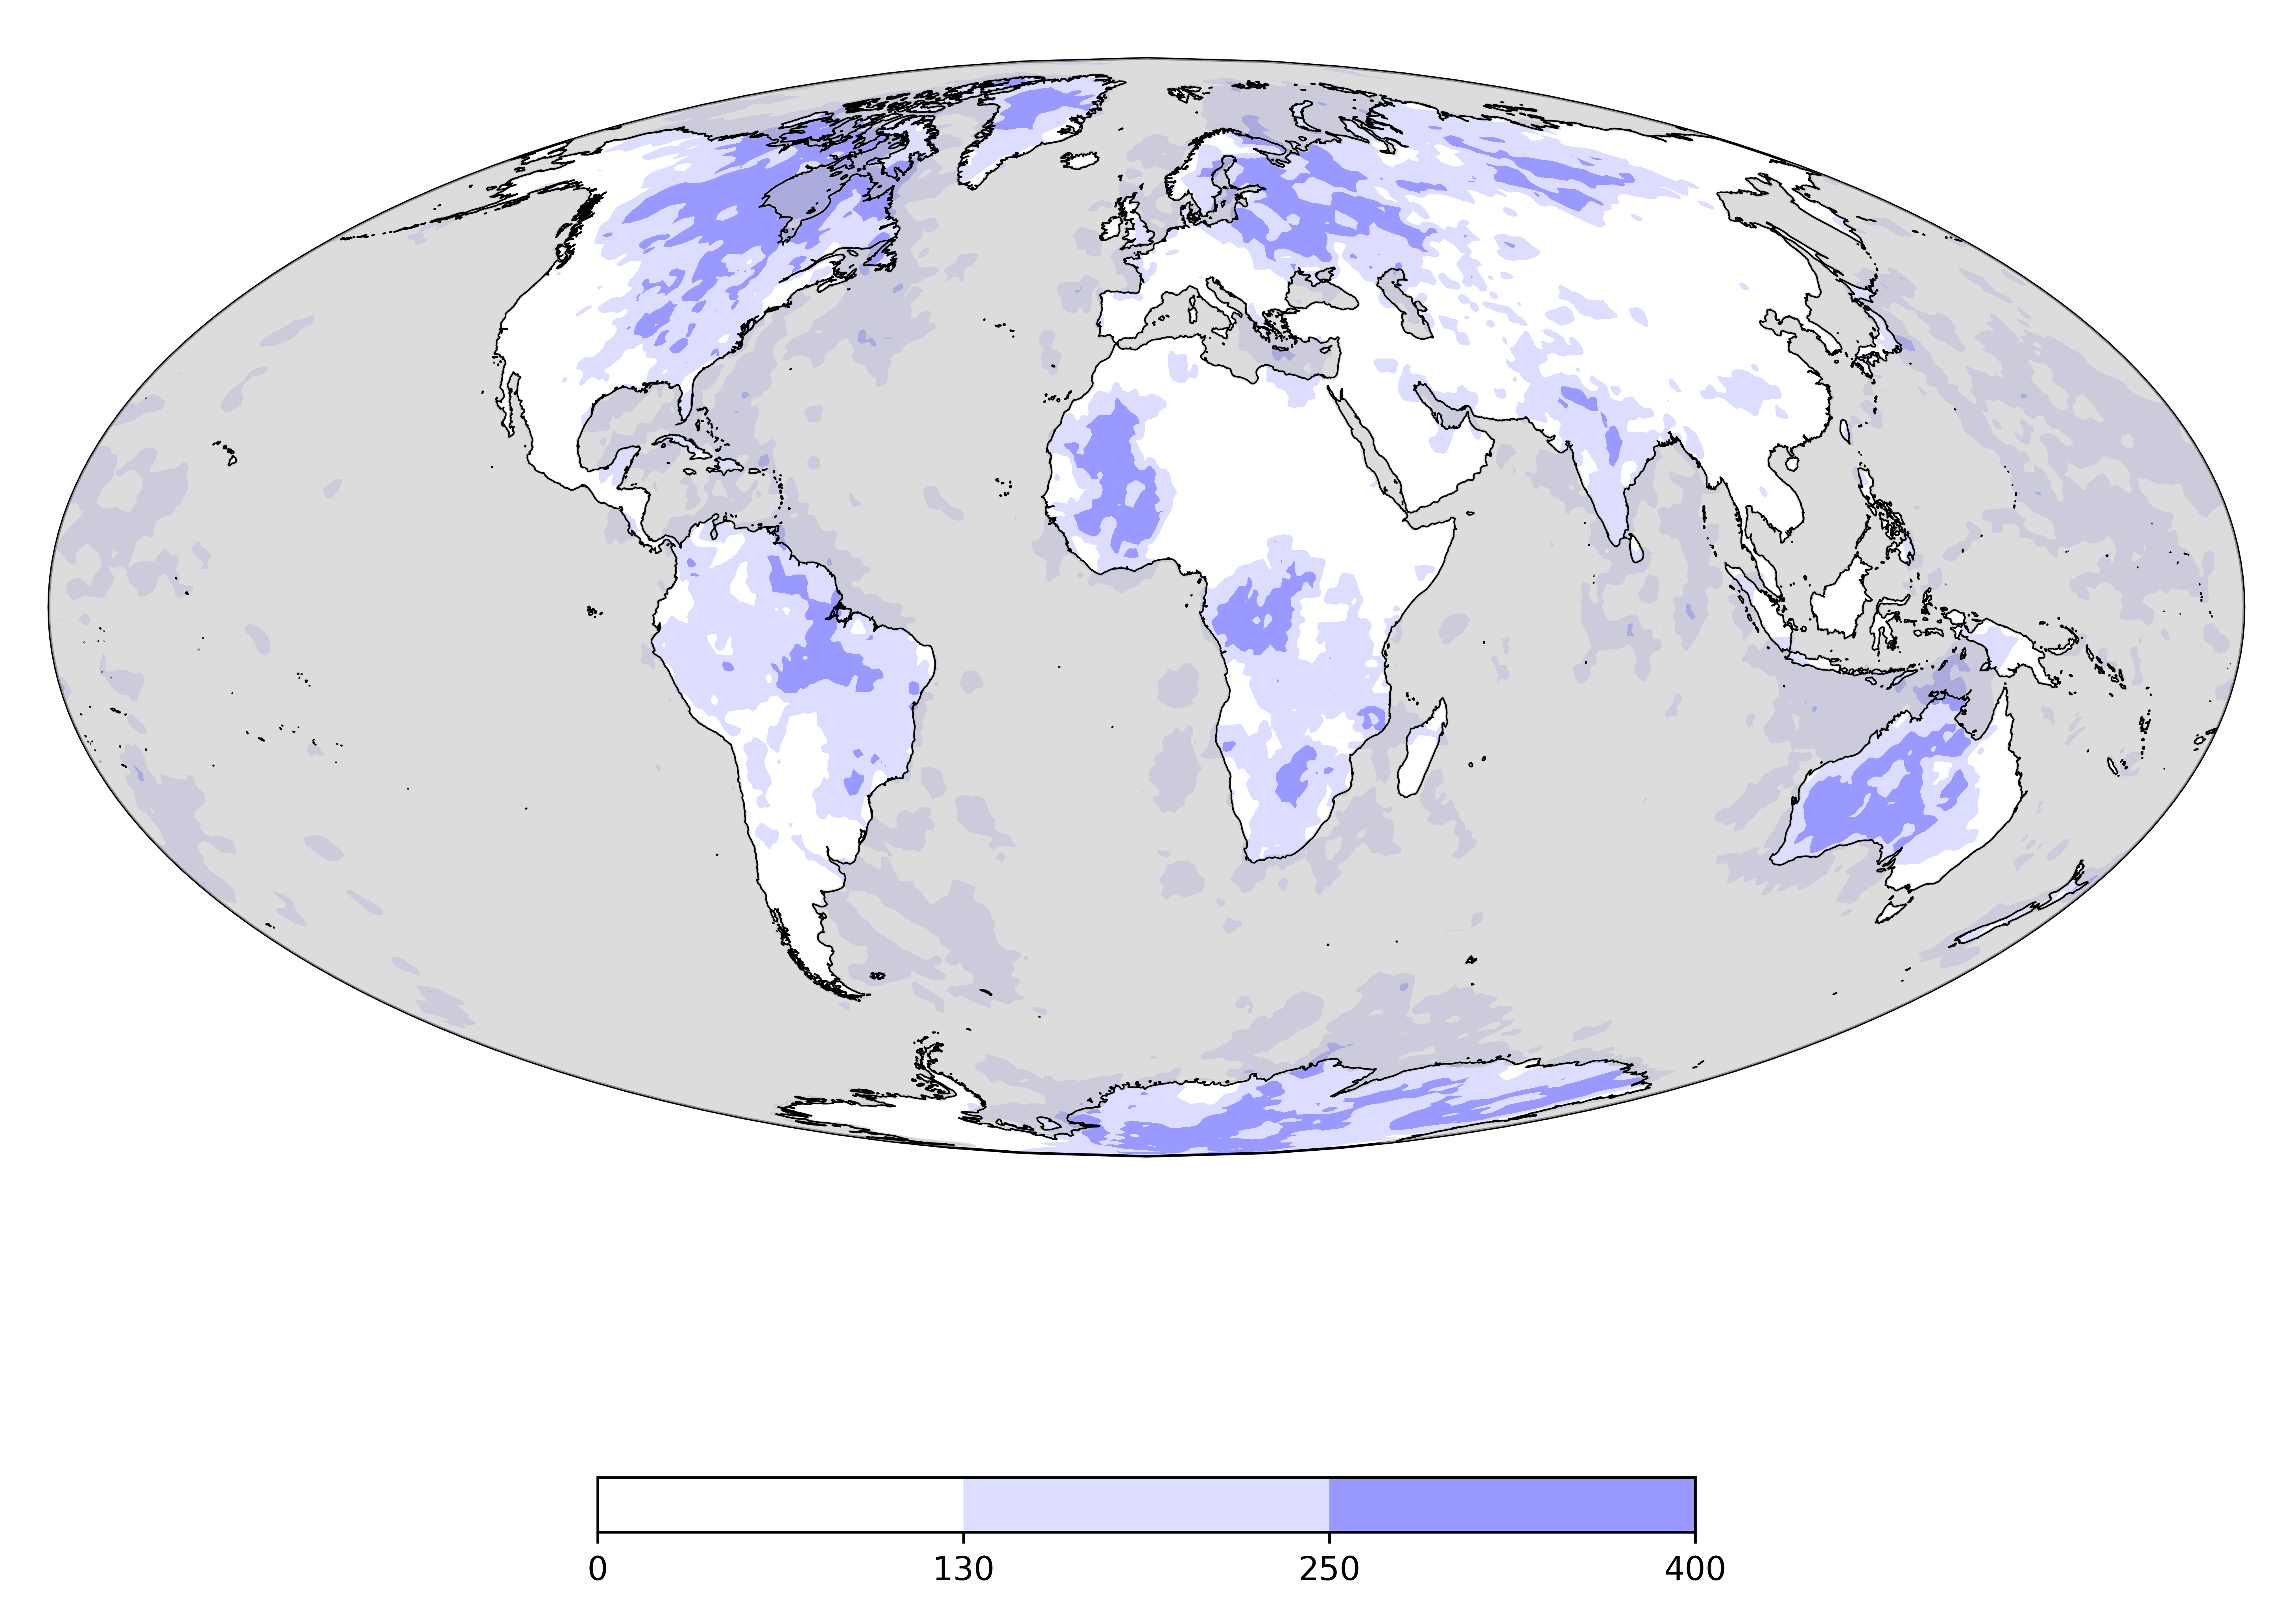
Earth - Global Heat-flow
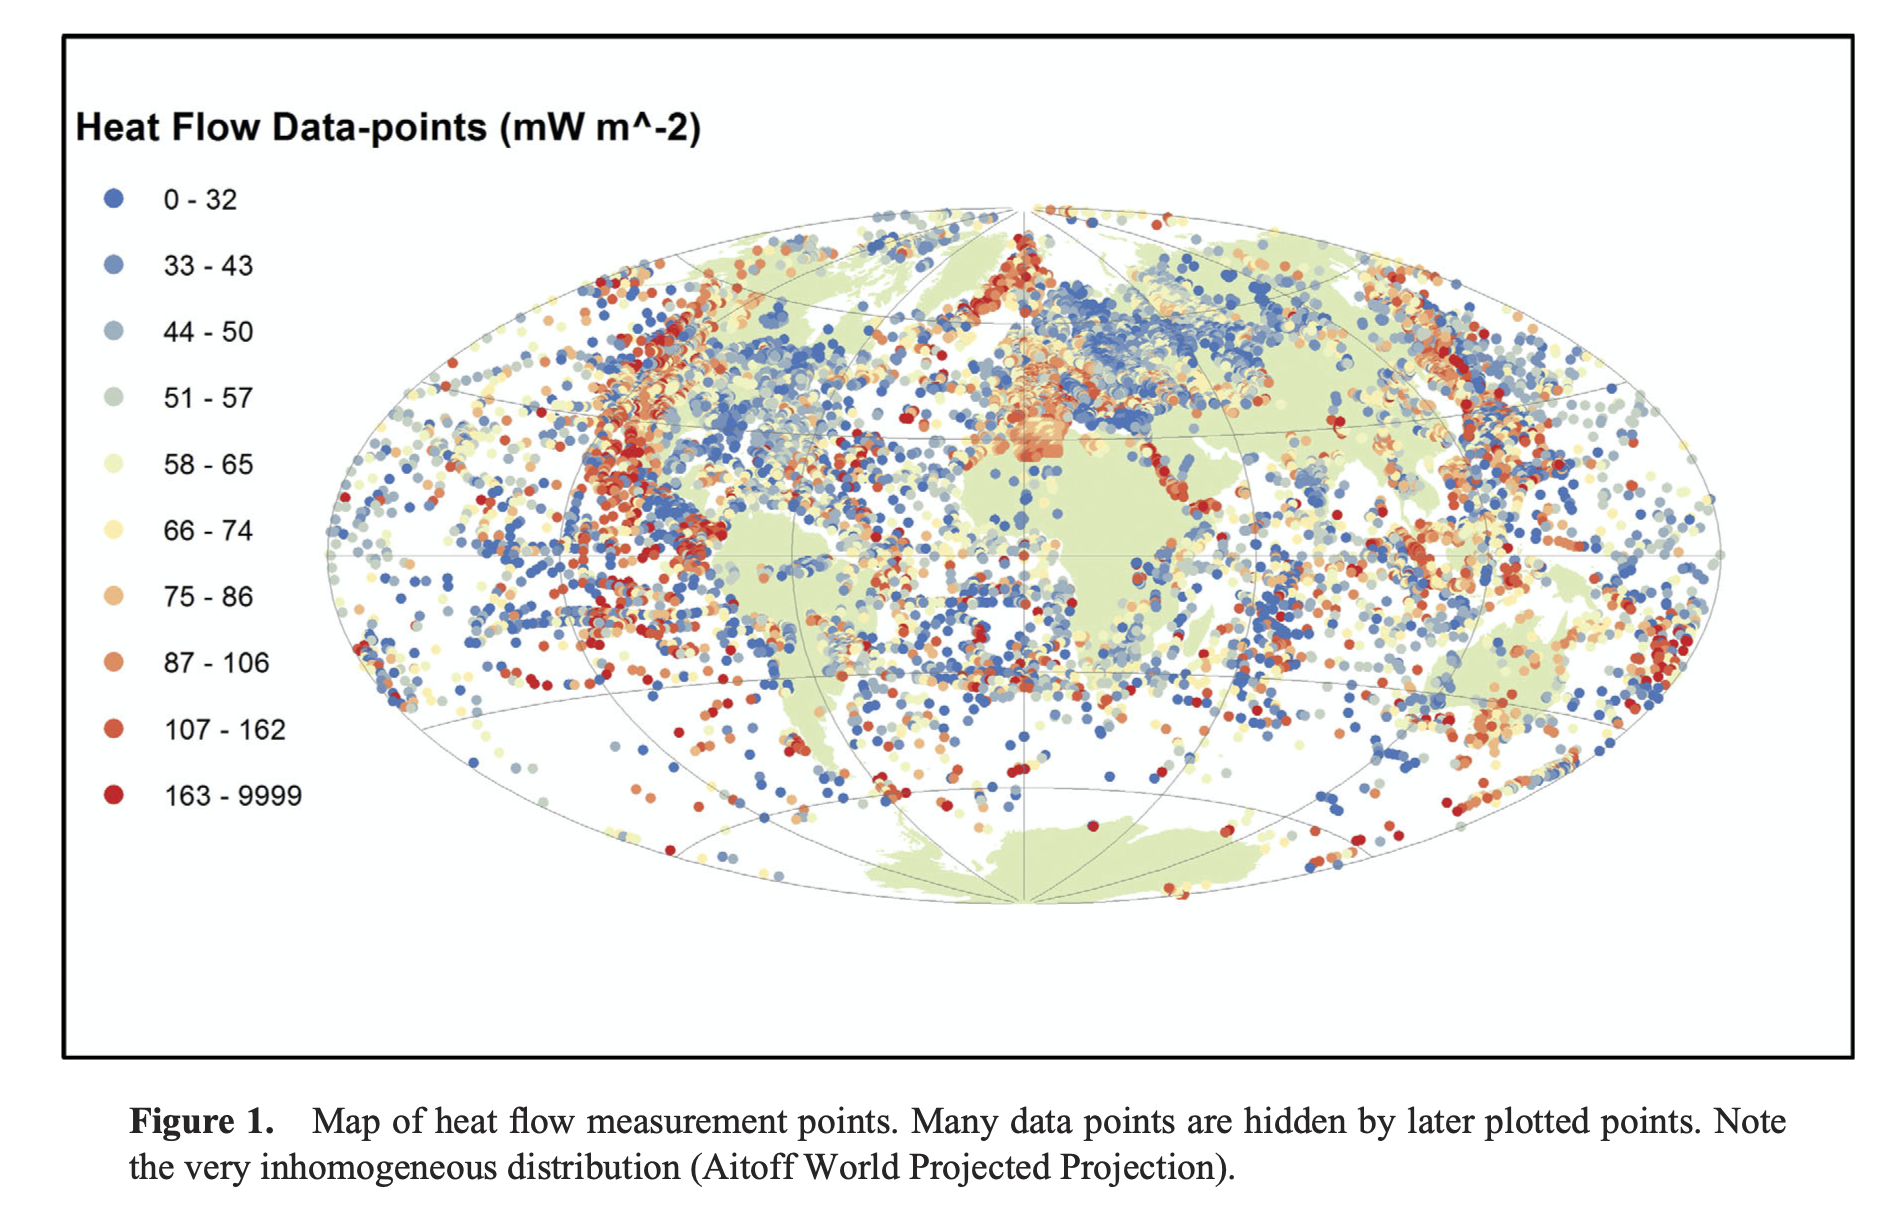
Raw data compiled by Davies & Davies 2013. There are really not very many reliable measurements.
Earth - Surface Motions
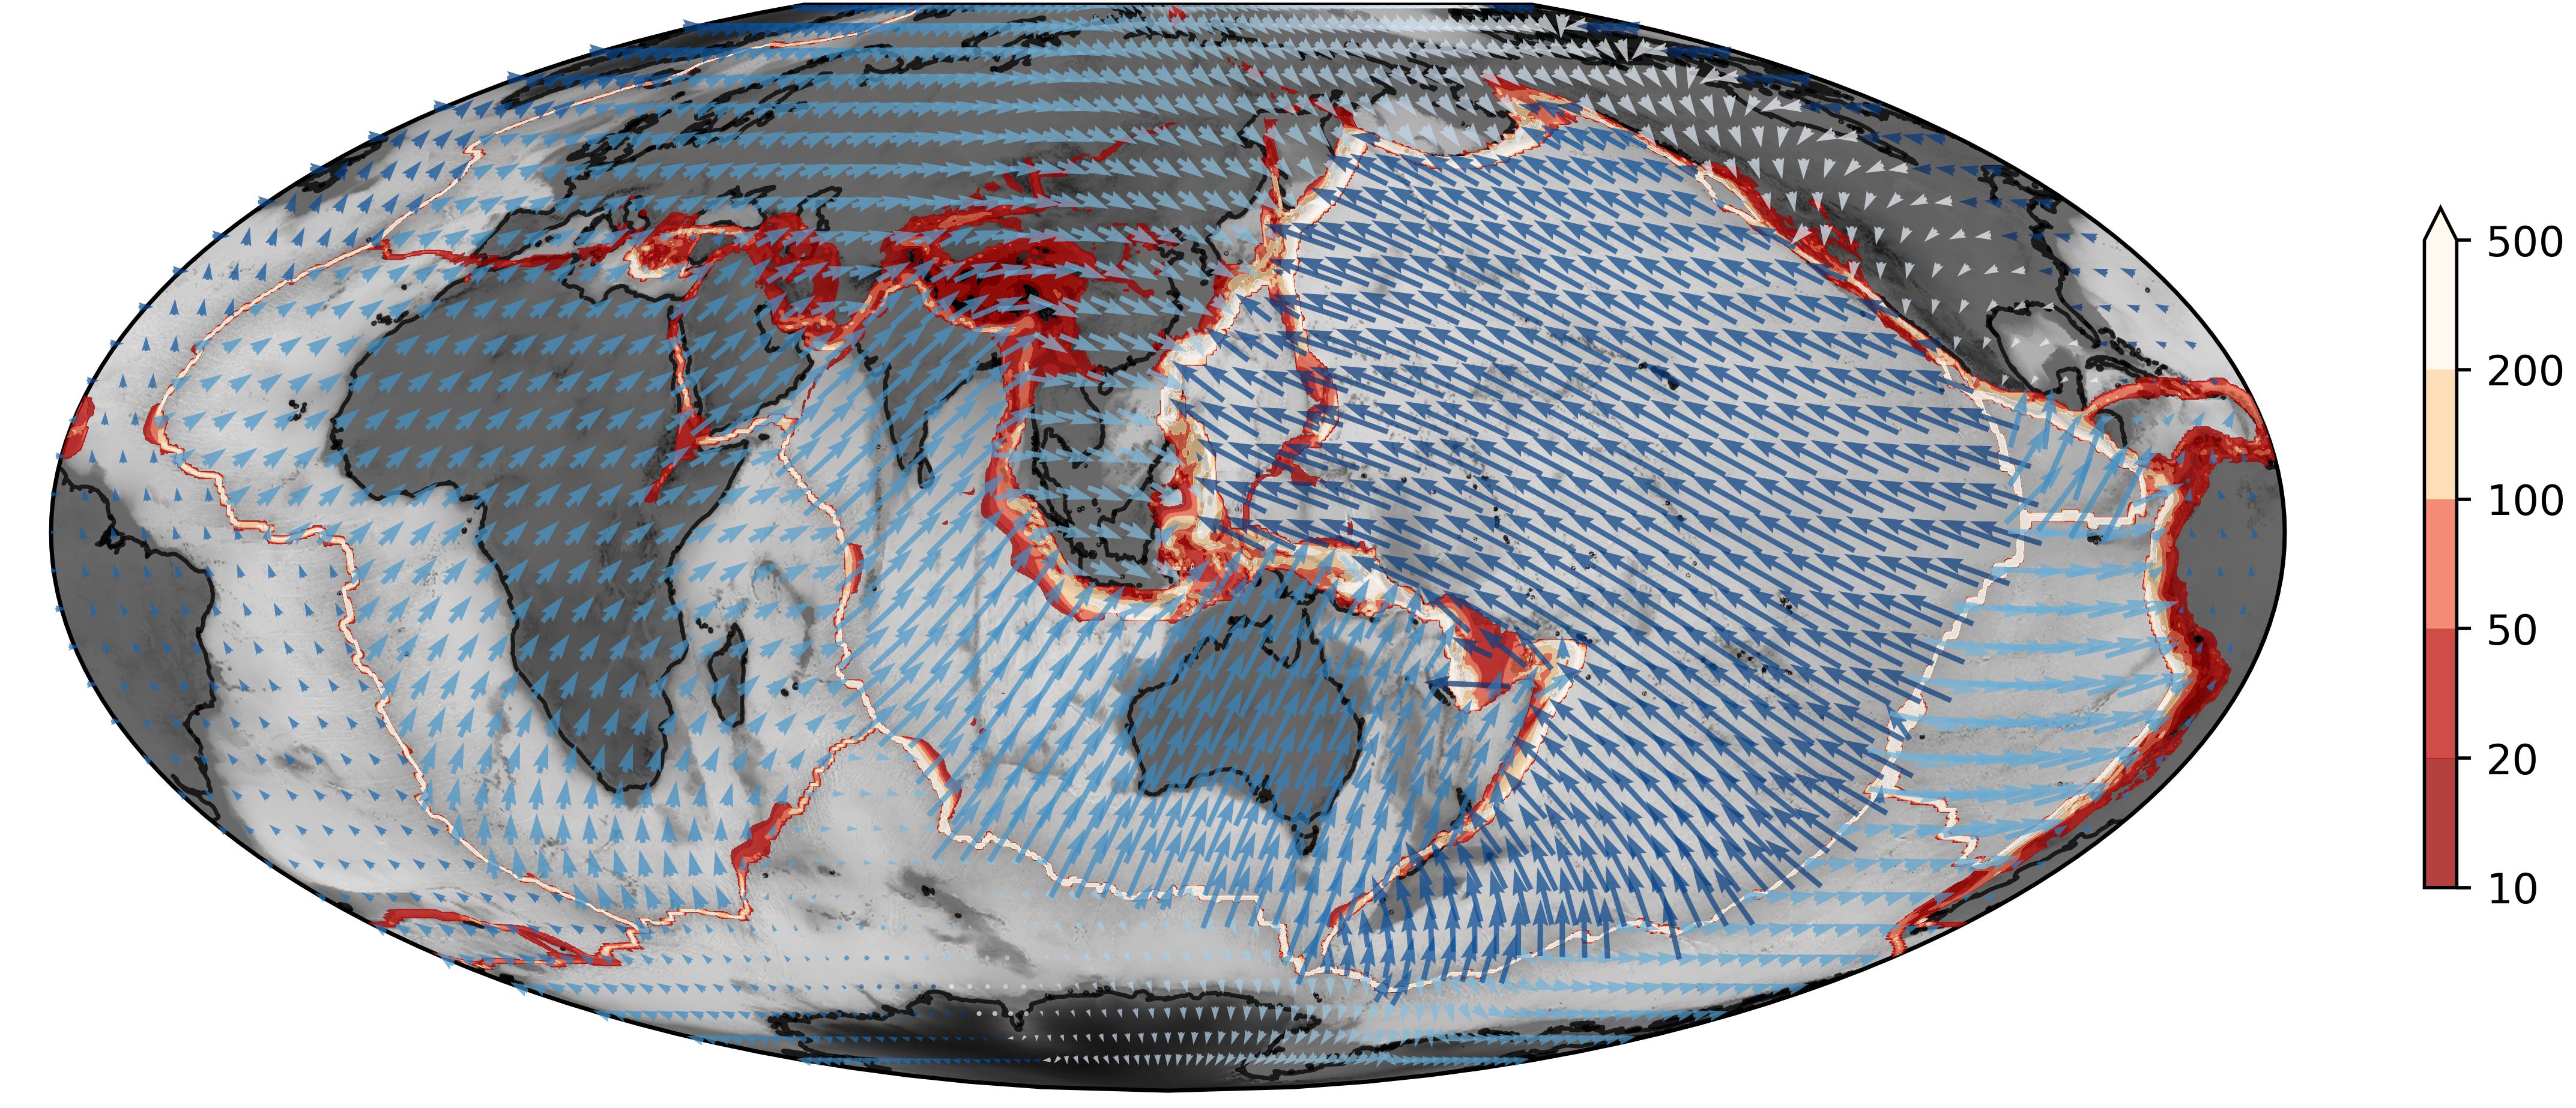
Directly observed plate motions (GPS, satellite ranging, very-long-baseline interferometry). Also shown, the strain-rate field, contoured to show highlight regions of high deformation rate.
Earth - Magnetic Field
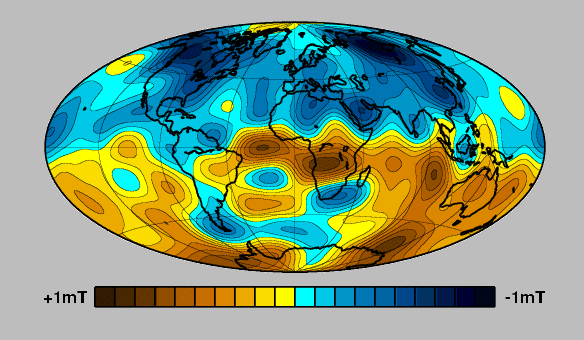
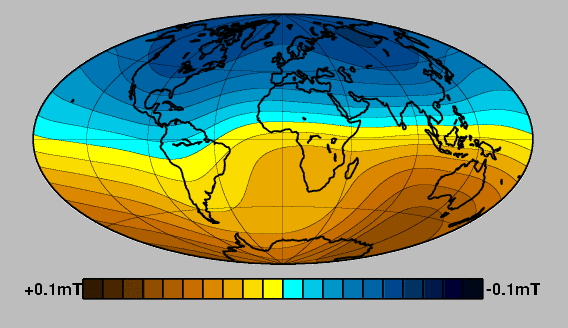
The Earth has a strong, dominantly dipolar, magnetic field which reverses chaotically but relatively regularly. These two features together allow
- paleo-latitudes to be determined
- ocean floor ages to be determined.
Earth - Sea Floor Magnetisation
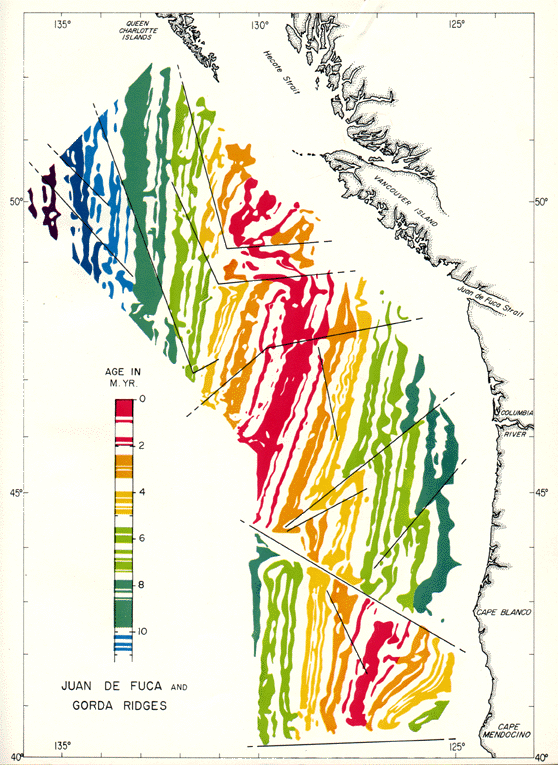
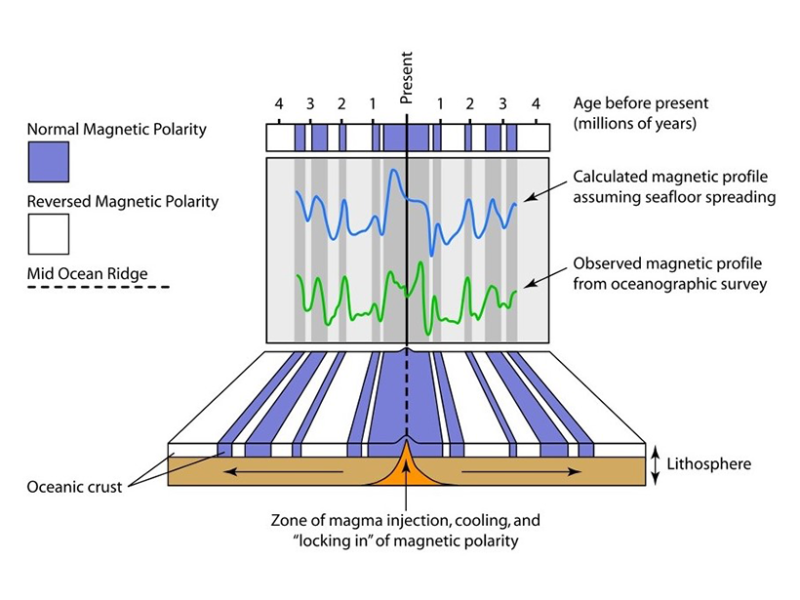
The morphology and bathymetry information comes to life when combined with the magnetic intensity maps of the mid-ocean ridge system. Chaotic magnetic reversal patterns combined with “steady” spreading produces a symmetric stripe-pattern that reflects the aging of the sea floor.
Earth - Sea Floor Age

Age distribution in the ocean floor is systematic and regular. It ranges from 0 (forming now) to ~200Myr. (credit: Earthbyte.org / Dietmar Müller)
Earth - Seismic Imaging / Tomography
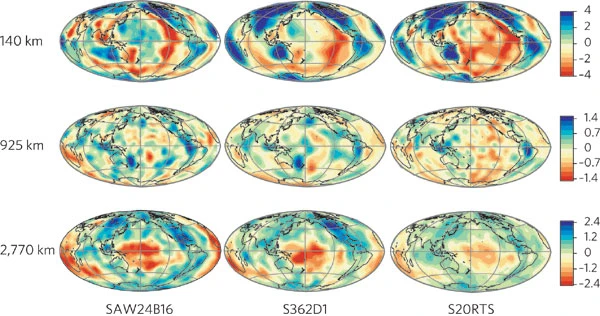
Each column of images represents a different model of mantle shear-velocity structure (using various data sources) shown at three representative depths (140 km, 925 km and 2,770 km). From Ramanowicz, 2008, Nature.
Earth - Sedimentary Records
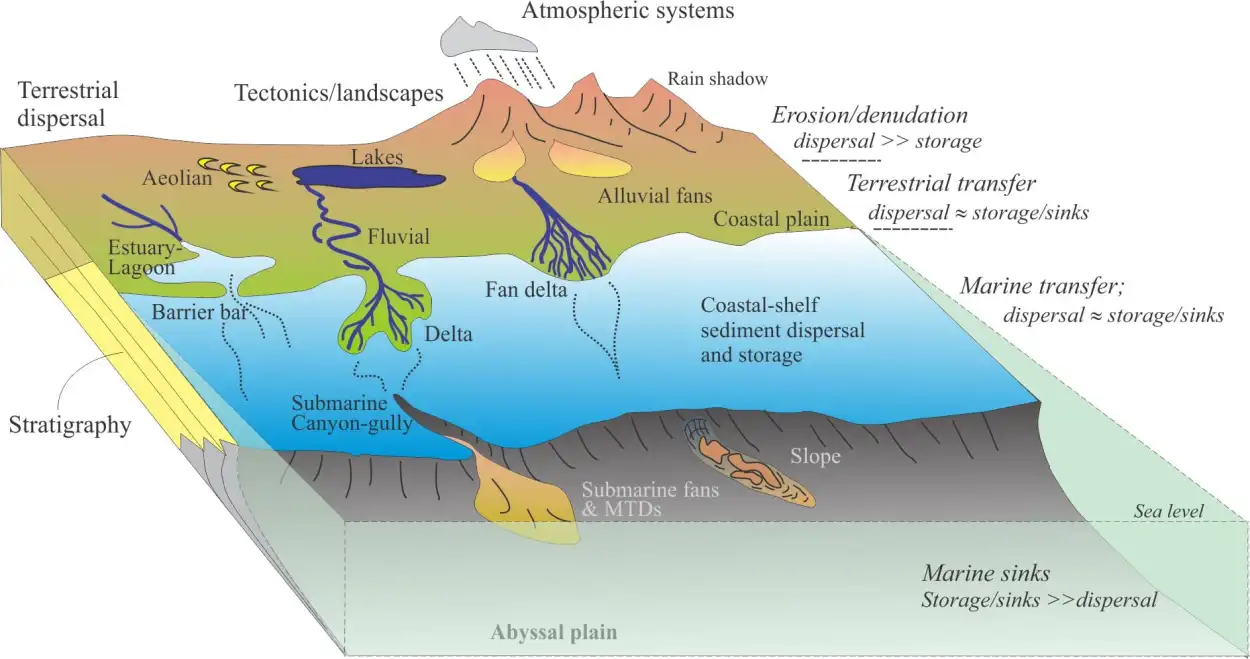
The linkages among the components of sediment routing systems: the source area (erosion), the transfer zone (rivers etc), and sinks (basins, deltas). In each zone, sediment may be stored temporarily, or accumulate in sinks if there is sufficient long-term accommodation.
Earth - Summary
We have huge advantages in understanding the Earth because we have nearly unlimited access to the surface, limited access to the subsurface by drilling, digging, sampling. We can go “wherever we want” to take measurements or samples.
We can set up imaging experiments that have long timescales and global reach. On other planets, we have shorter experiments and everything is significantly limited in terms of duration and access.
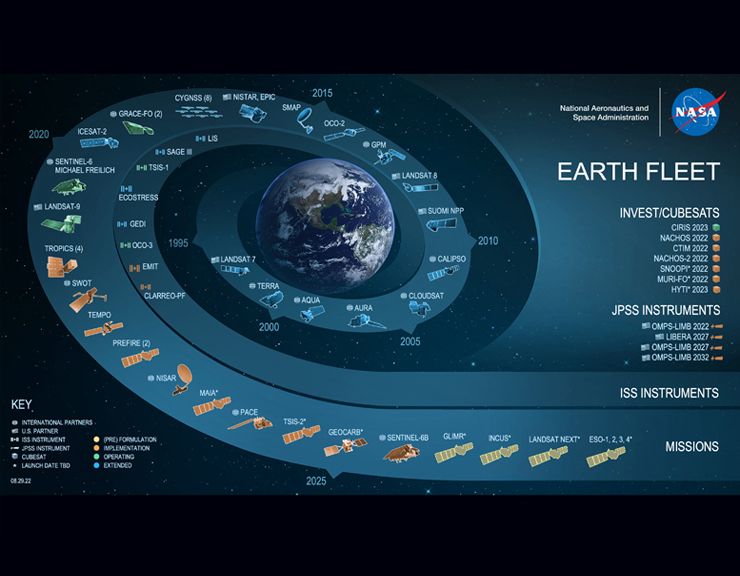
We have huge fleets of observing satellites and remote telemetry of discrete sensors.